Tracking your first events
Once your pipeline is set up, you will want to send some events to it. Here’s an overview of the different options.
Keep in mind that some of our offerings have limits on the number of events you can send:
- For Try Snowplow, there is cap of 50 events per second. Any events above this cap will be dropped
- For Open Source, the default setup is sized for around 100 events per second
Regardless of how you send the events, it might take a few minutes for them to reach your destination (e.g. data warehouse). This depends on which destination and loader you have configured.
A quick test
If you are eager to look at some Snowplow events or just test your pipeline, you can use the box below to send some data (including failed events) to your Collector.
- BDP Enterprise
- BDP Cloud
- Try Snowplow
- Open Source
You can find the Collector URL (Collector Endpoint) in the Console.
You can find the Collector URL (Collector Endpoint) in the Console.
You can find the Collector URL (Collector Endpoint) in the Console.
Input the Collector URL you’ve chosen when deploying your Open Source pipeline.
If you have not yet configured an SSL certificate and a custom domain name for your Collector, you can use http://<collector_dns_name> (http, not https), where collector_dns_name is the output of the pipeline Terraform module.
Which events are sent?
window.snowplow('trackSelfDescribingEvent',
  {
    event: {
      schema: 'iglu:com.snowplowanalytics.snowplow/add_to_cart/jsonschema/1-0-0',
      data: { sku: 'ASO01043', unitPrice: 49.95, quantity: 1000 }
    }
  }
)
window.snowplow('trackSelfDescribingEvent',
  {
    event: {
      schema: 'iglu:com.snowplowanalytics.snowplow/link_click/jsonschema/1-0-1',
      data: {
        targetUrl: 'https://snowplow.io'
      }
    }
  }
)
window.snowplow('trackSelfDescribingEvent',
  {
    event: {
      schema: 'iglu:com.snowplowanalytics.mobile/deep_link/jsonschema/1-0-0',
      data: {
        url: 'https://snowplowanalytics.com'
      }
    }
  }
)
window.snowplow('trackSelfDescribingEvent',
  {
    event: {
      schema: 'iglu:com.snowplowanalytics.snowplow/link_click/jsonschema/1-0-1',
      data: {
        targetUrl: 'https://snowplow.io'
      }
    },
    context: [
      {
        schema: 'iglu:com.snowplowanalytics.snowplow/web_page/jsonschema/1-0-0',
        data: {
          id: '6a2a8c7c-8e7a-4e9f-9b4c-0f4f9a3f35a9'
        }
      }
    ]
  }
)
window.snowplow('trackPageView', undefined)
window.snowplow('trackPageView', { title: 'My custom page title' })

// Bad Events
window.snowplow('trackSelfDescribingEvent',
  {
    event: {
      schema: 'iglu:com.fake_event/event/jsonschema/1-0-0',
      data: { foo: 'bar' }
    }
  }
)
window.snowplow('trackSelfDescribingEvent',
  {
    event: {
      schema: '',
      data: {}
    }
  }
)
window.snowplow('trackSelfDescribingEvent',
  {
    event: {
      schema: 'iglu:com.snowplowanalytics.snowplow/link_click/jsonschema/1-0-1',
      data: {
        invalidProperty: "This schema doesn't have this property"
      }
    }
  }
)
An application ID is sent along with each Snowplow event. You can pick a value that will make it easy to filter out these test events from your data later, e.g. like this:
...
WHERE app_id != 'test'
...
Now, let’s take a look at how to set up actual event tracking.
Using the JavaScript tracker
The JavaScript tracker is our most commonly used tracker. It’s a good choice for websites, and the installation process is similar to other tools like Google Analytics.
To use the JavaScript tracker on your site, you will need to obtain a code snippet first.
- BDP Enterprise
- BDP Cloud
- Try Snowplow
- Open Source
BDP Enterprise can automatically generate the snippet for you. Go to the tag generator screen, fill in the necessary parameters, and copy the snippet at the bottom.
You can find the pre-generated snippet in the Getting started section.
You can find the pre-generated snippet in the Console.
Take note of the Collector URL you’ve chosen when deploying your Open Source pipeline.
If you have not yet configured an SSL certificate and a custom domain name for your Collector, you can use http://<collector_dns_name> (http, not https), where collector_dns_name is the output of the pipeline Terraform module.
Then, follow the JavaScript tracker quick start guide to create your snippet.
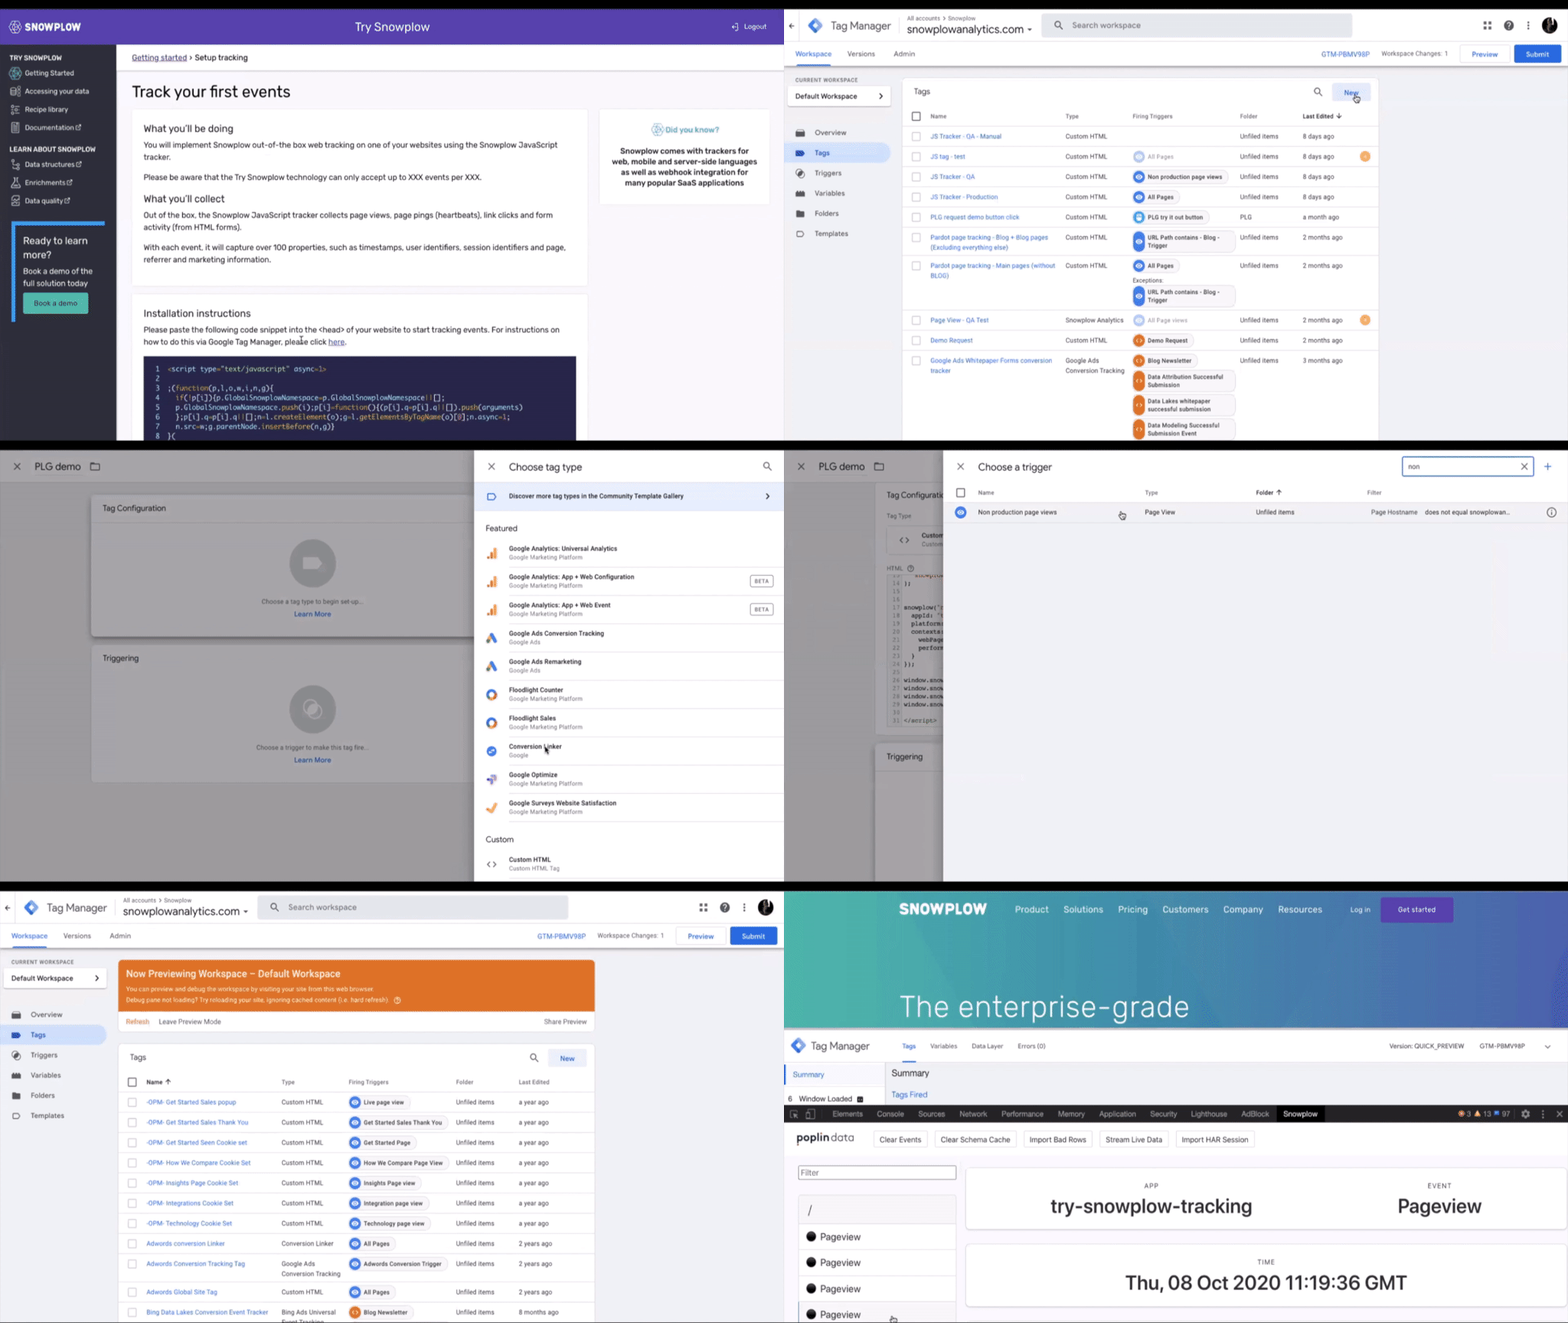
Once you have the snippet, there are two common ways to deploy it.
- Editing your website directly
- Using Google Tag Manager
If you have access to the source code of your site, paste the snippet into the <head> HTML section and deploy the changes.
If you are already using Google Tag Manager to add various code snippets to your site, you can add your Snowplow snippet there.

- Navigate to the Google Tag Manager account you wish to add tracking to
- Create a new Custom HTML tag and paste the Javascript snippet into the tag
- Set it to fire on 'All Pages' or a trigger of your choosing
- You can preview your tag to send some events before publishing it
The JavaScript tracker captures many events (e.g. page views) automatically, so you should start accumulating your first events as soon as the changes are rolled out to your users.
Using other trackers
We have many different trackers in different programming languages, in case the JavaScript tracker is not a fit for you. For example, see the mobile native trackers or the full list of what’s available.
For quick testing, you might be tempted to send data to your Collector URL using a basic command-line tool like cURL. However, you would need to ensure that the data format follows our tracker protocol. Instead, take a look at the command-line tracker that will do this for you.