Snowplow Micro User Interface
To view the Micro UI, head to http://localhost:9090/micro/ui in your web browser (assuming you followed the basic usage instructions).
Overview
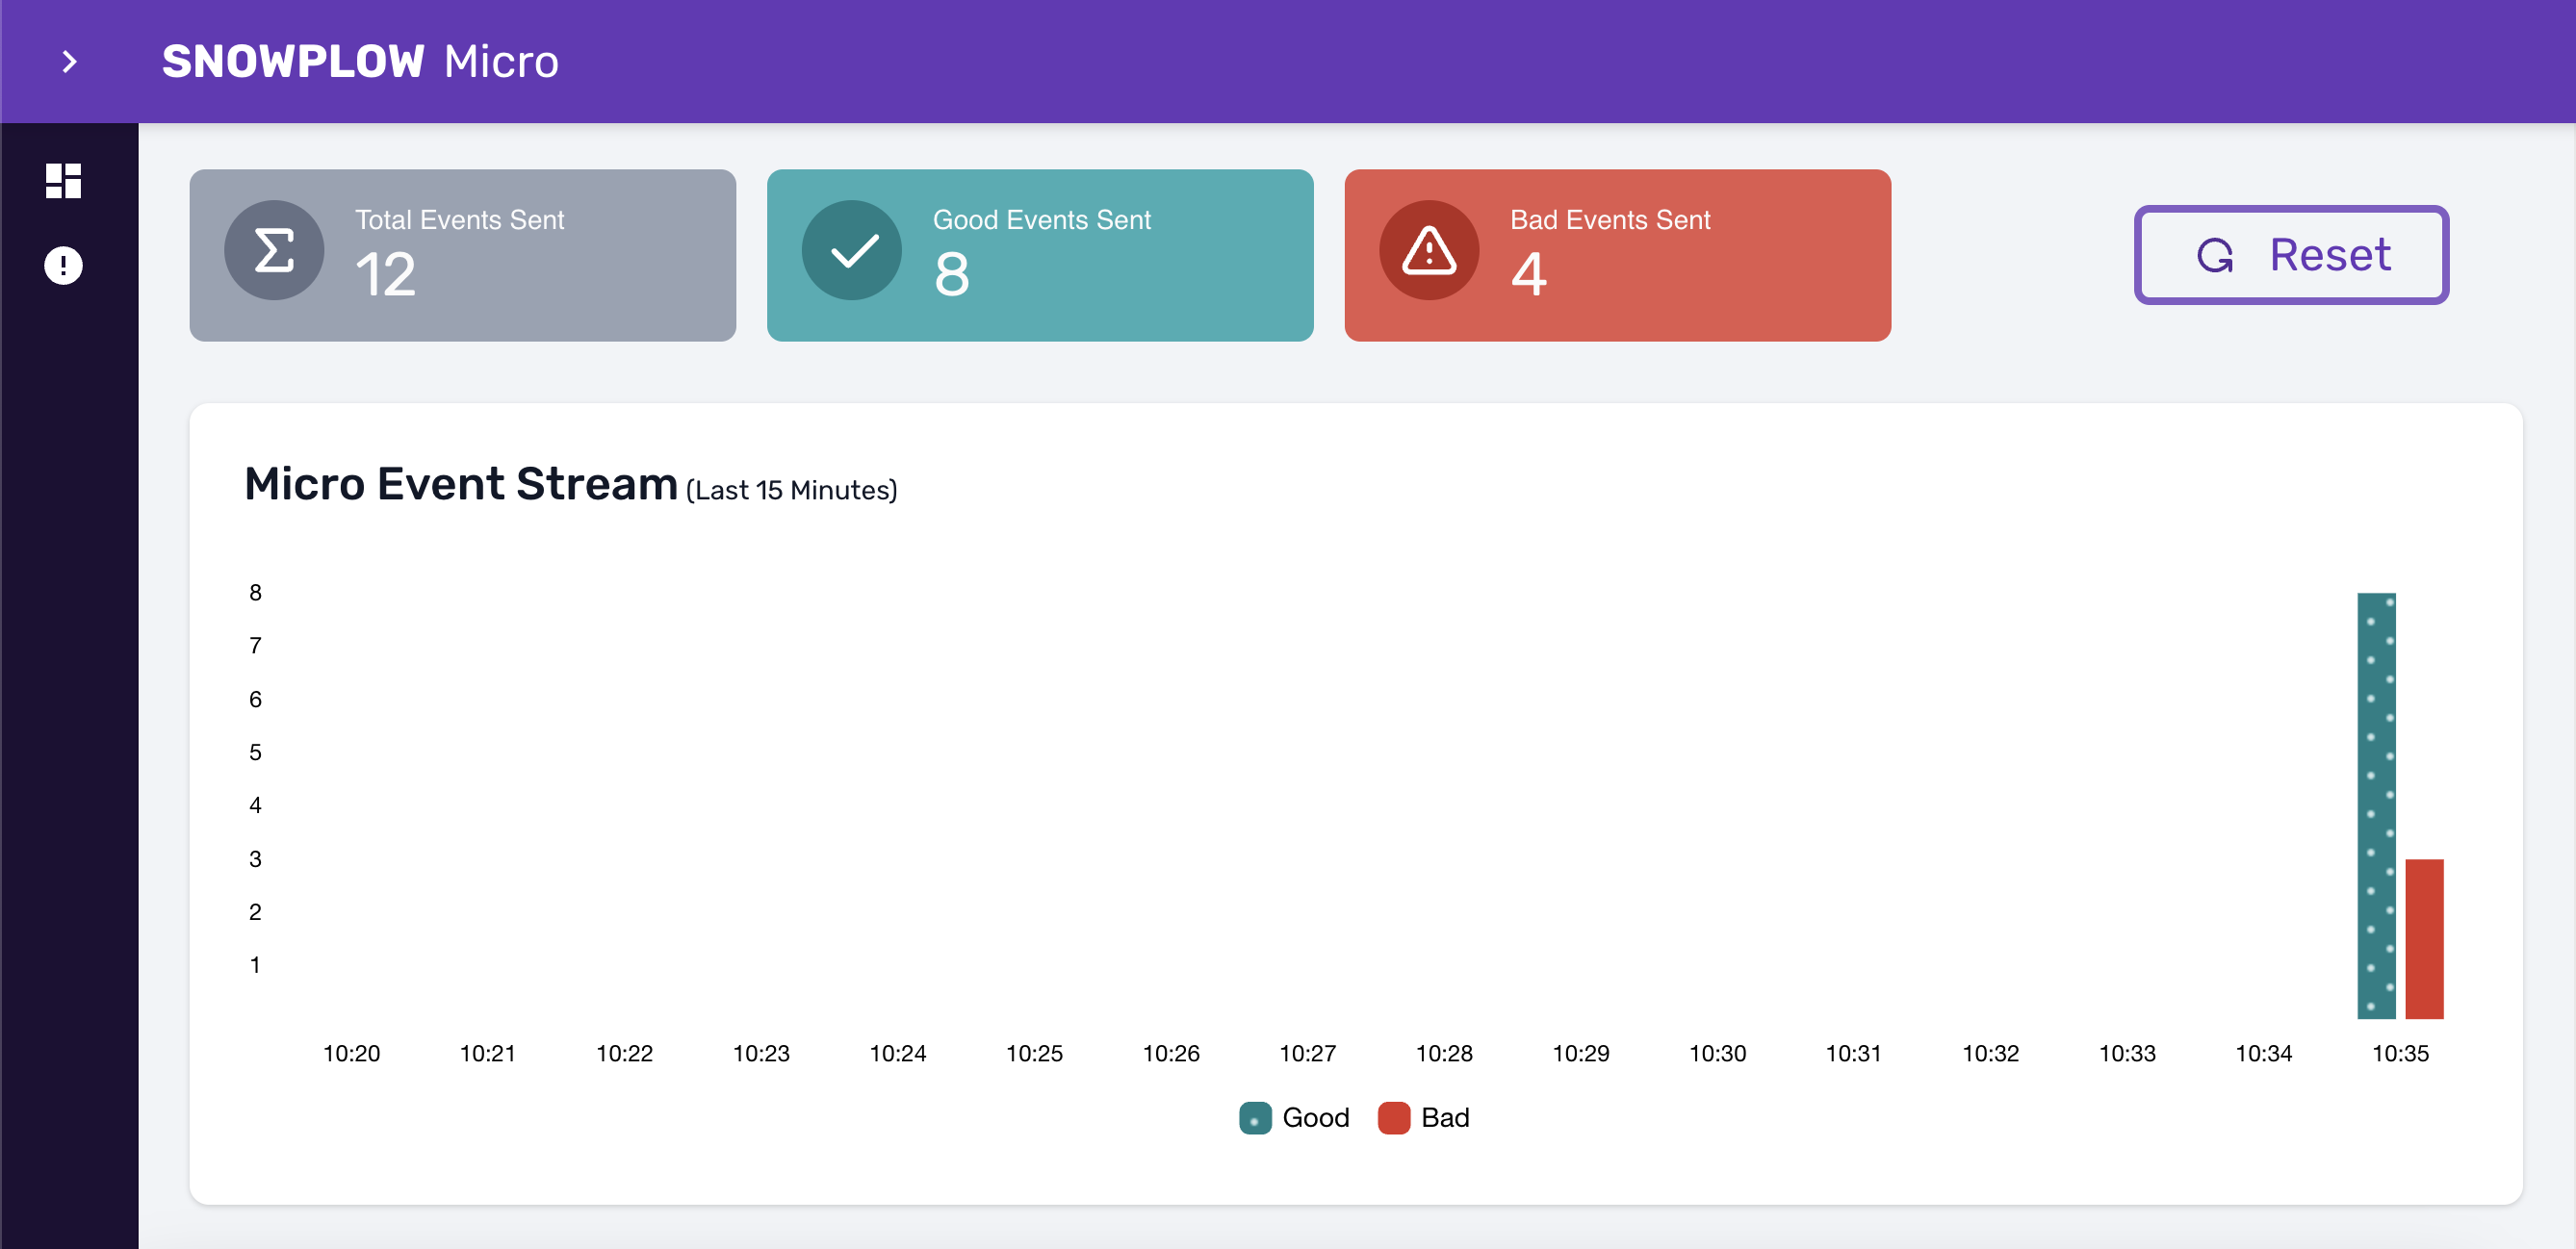
The first thing you will see in the UI is the overview section, which tells you how many good (valid) and bad (failed) events you have received:
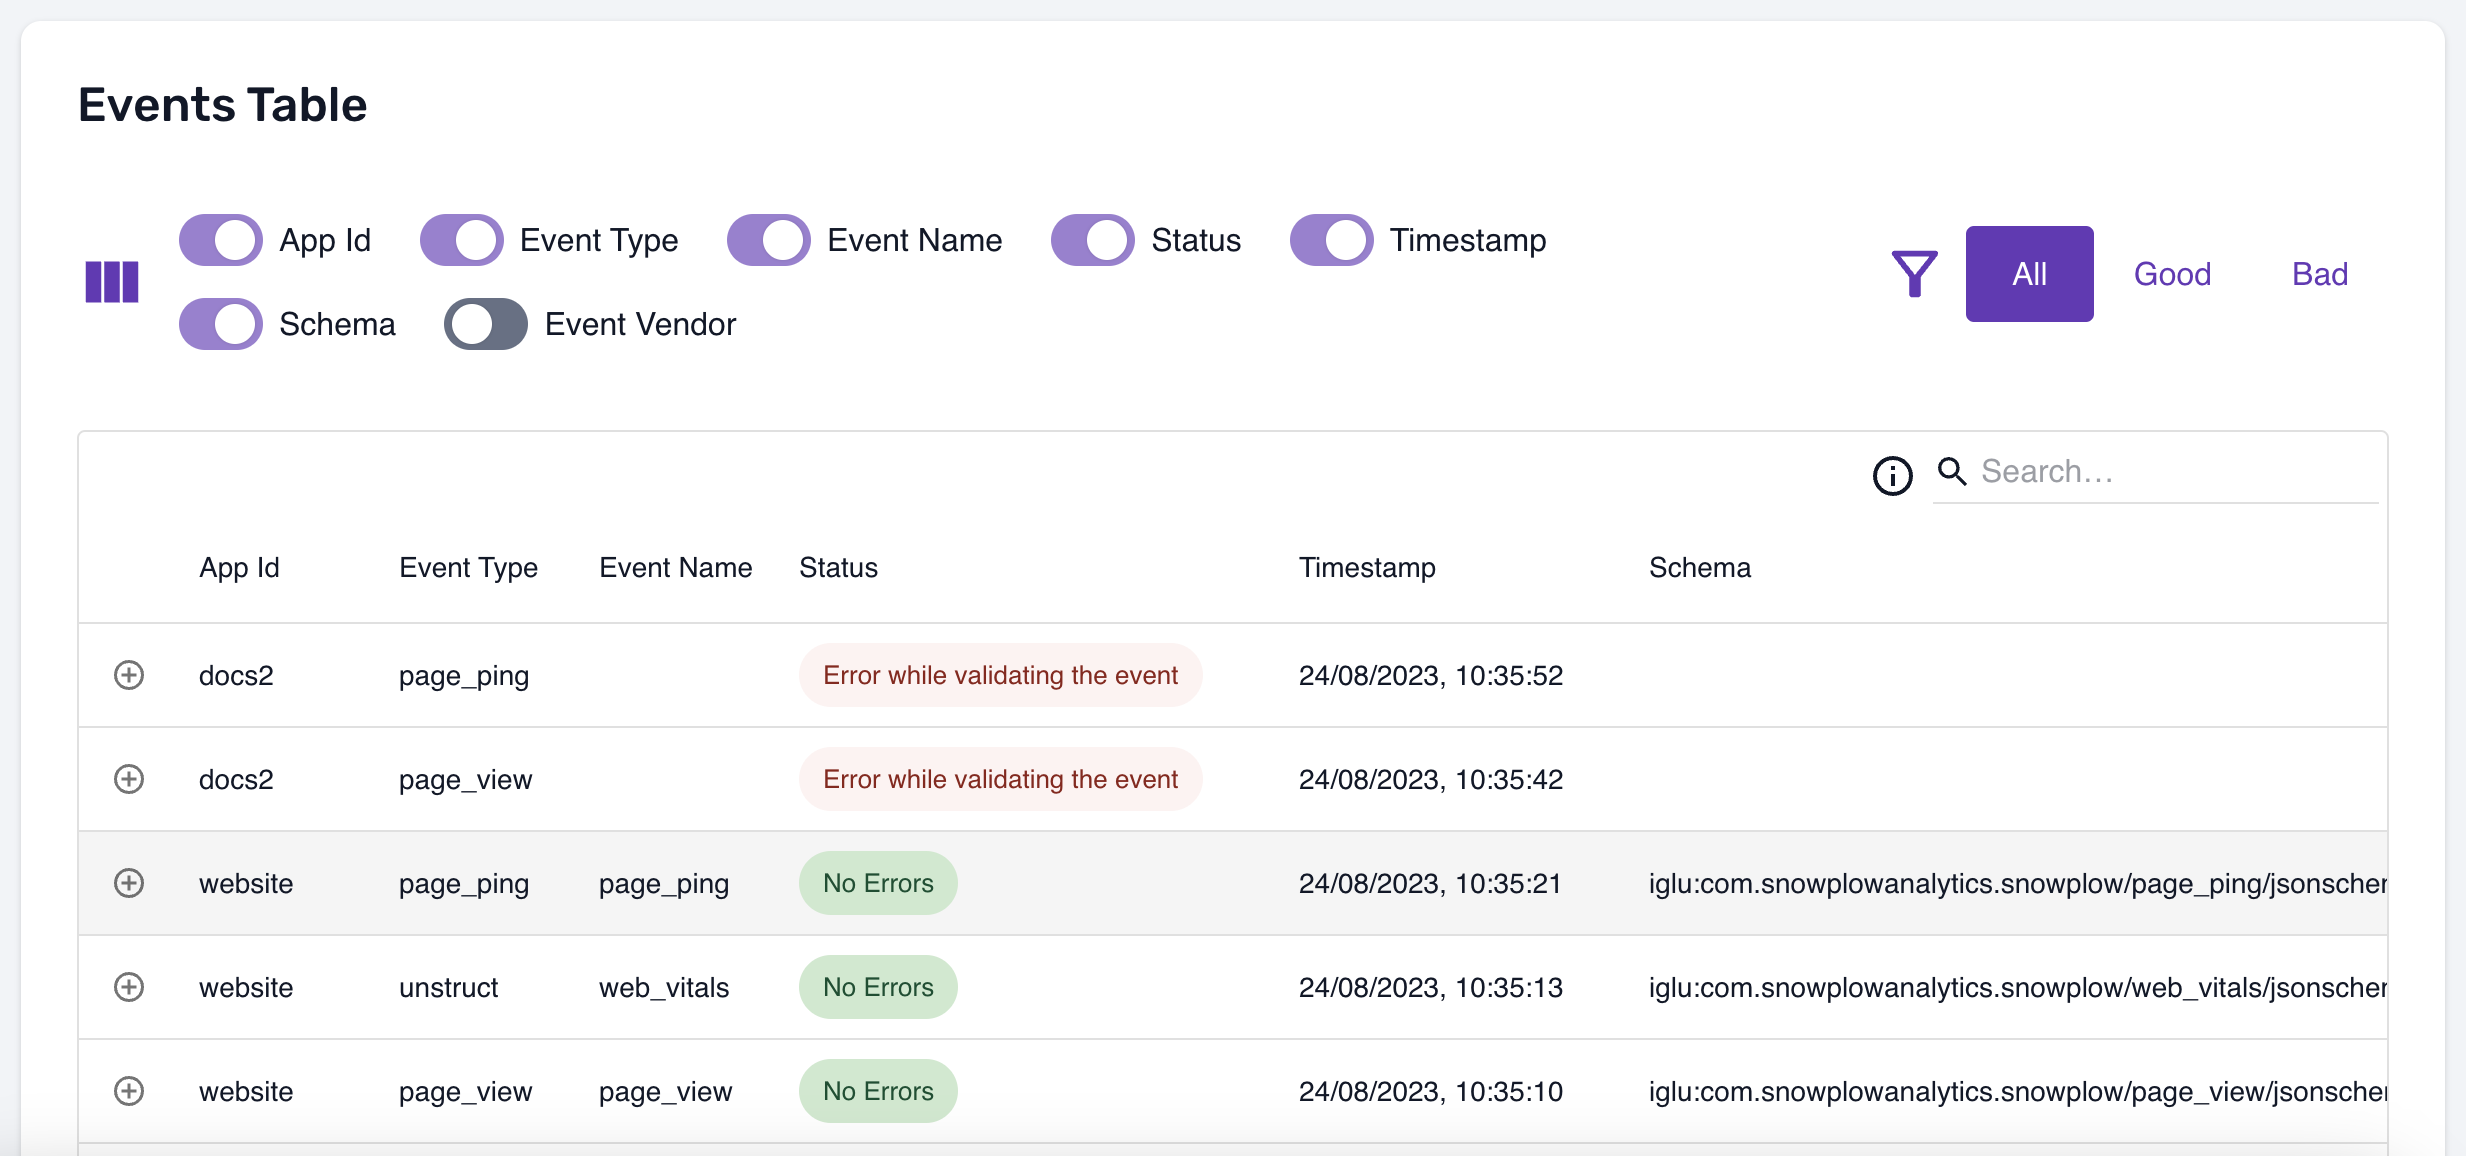
Below the overview, there is a table showing all events in more detail:
Want to share this view with a colleague? See the section on exposing Micro to the outside world. For example, if you use ngrok, you will get a link like https://1328-...-4103.ngrok-free.app/micro/ui which you can send to anyone for them to look at the same events.
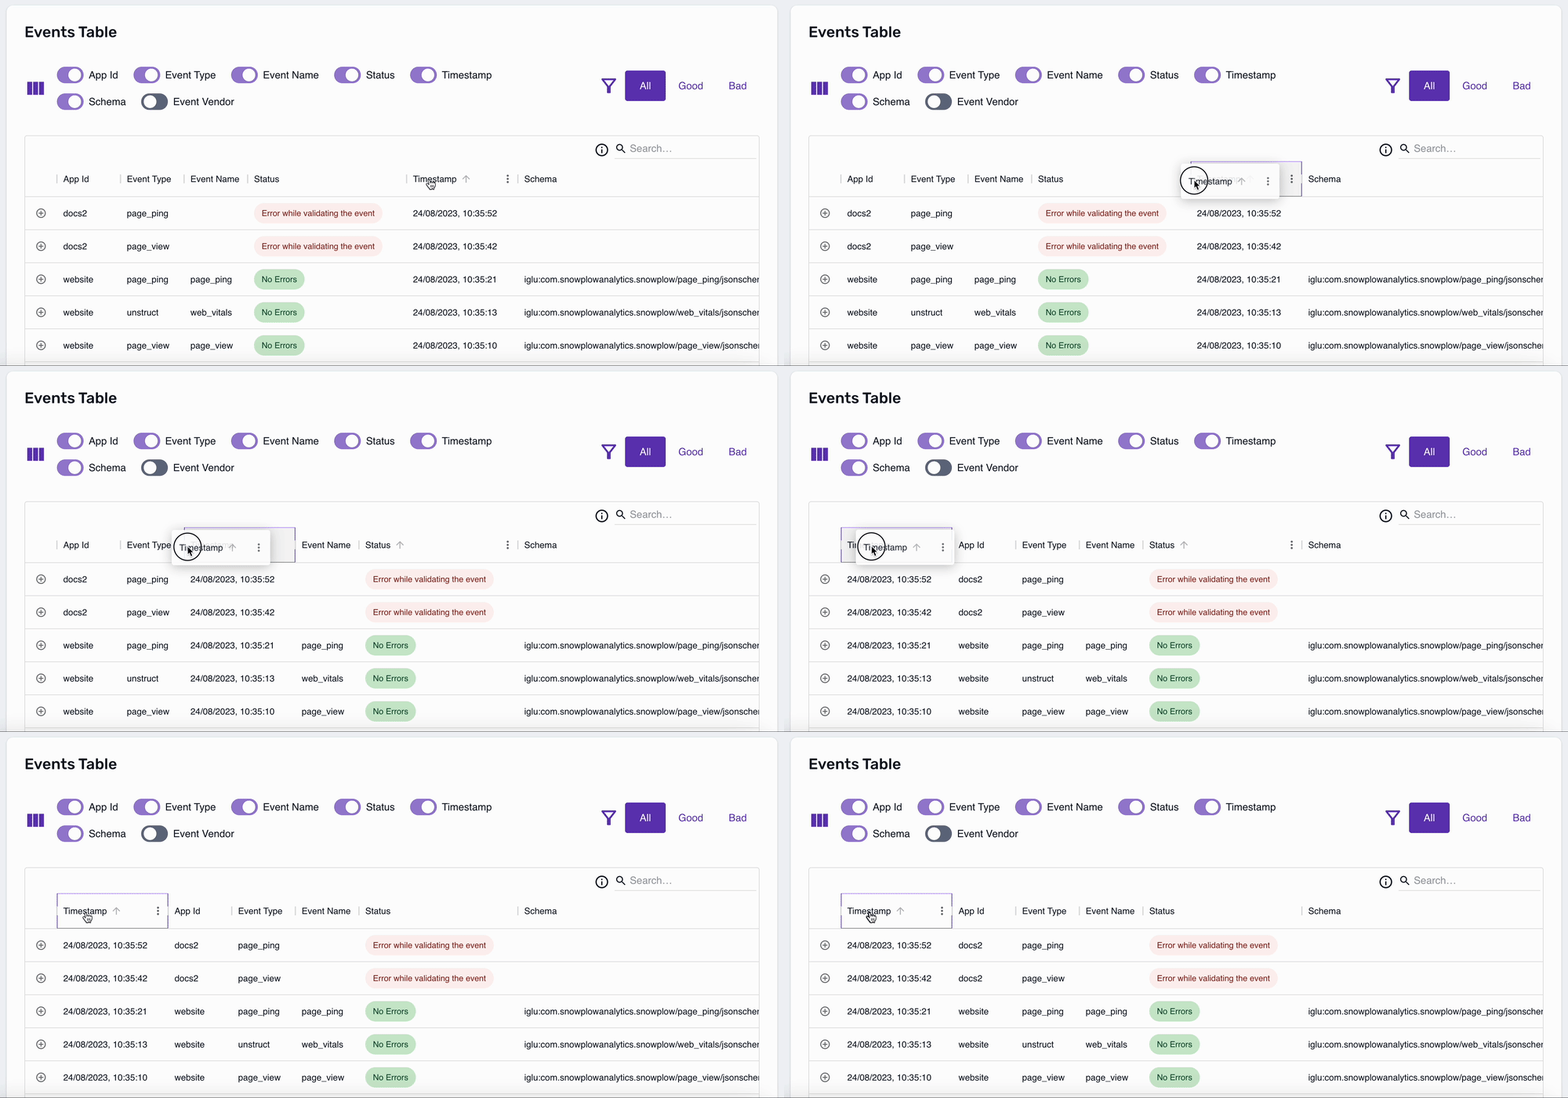
Note that you can reorder the columns in the table as you wish:
Filtering events
There are a few ways to filter the events in the table.
First, there is a good/bad event selector:

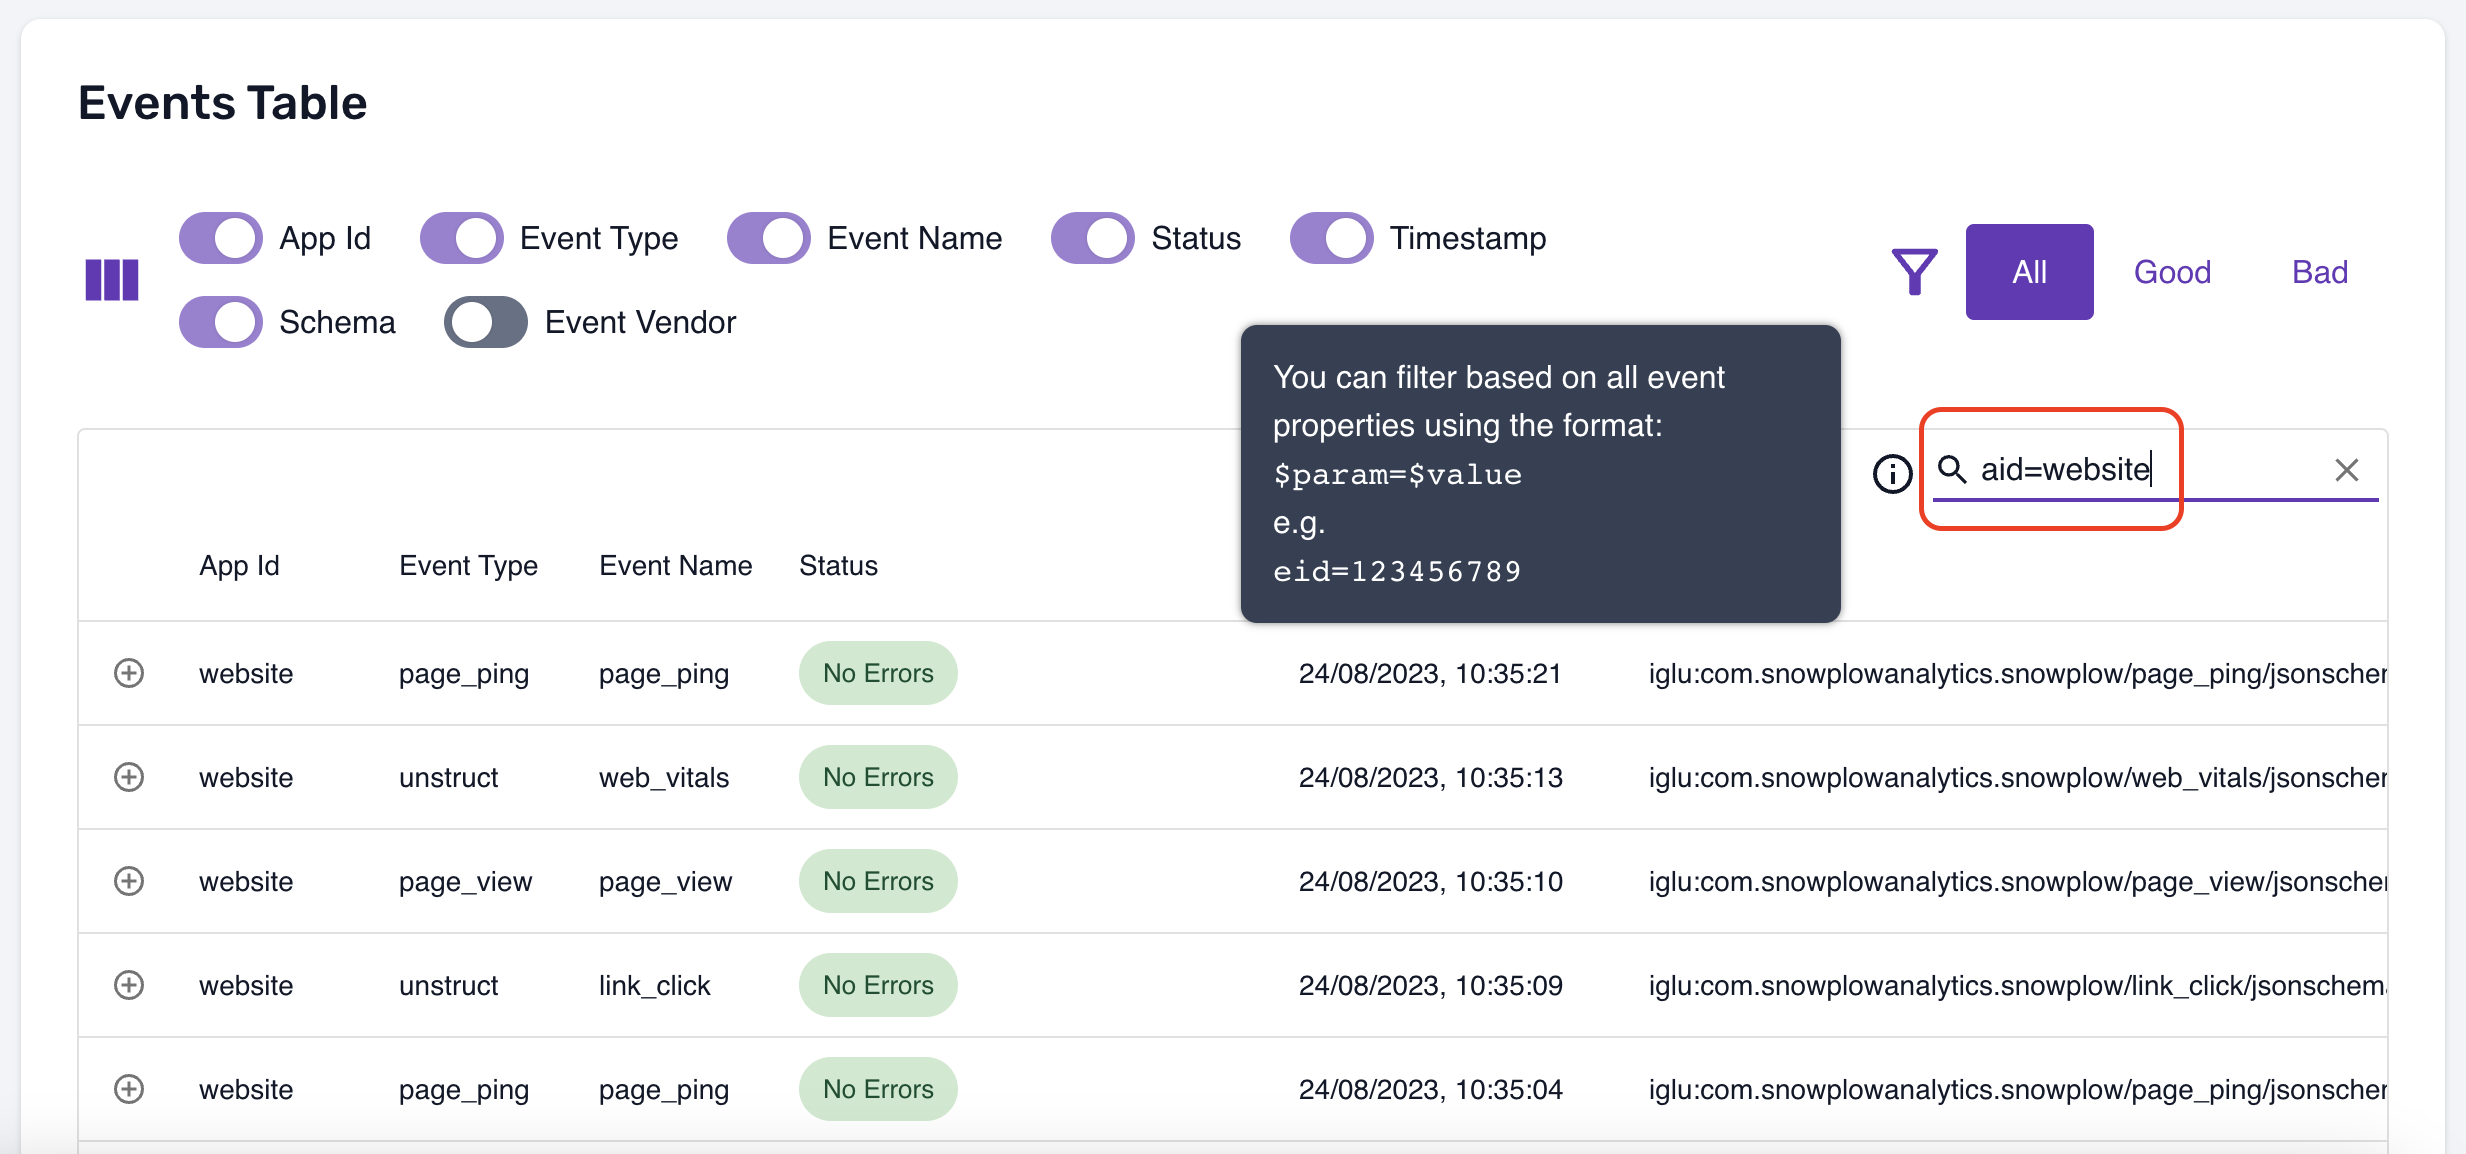
Second, you can use the search bar, which supports both free text searches and searching within specific fields:
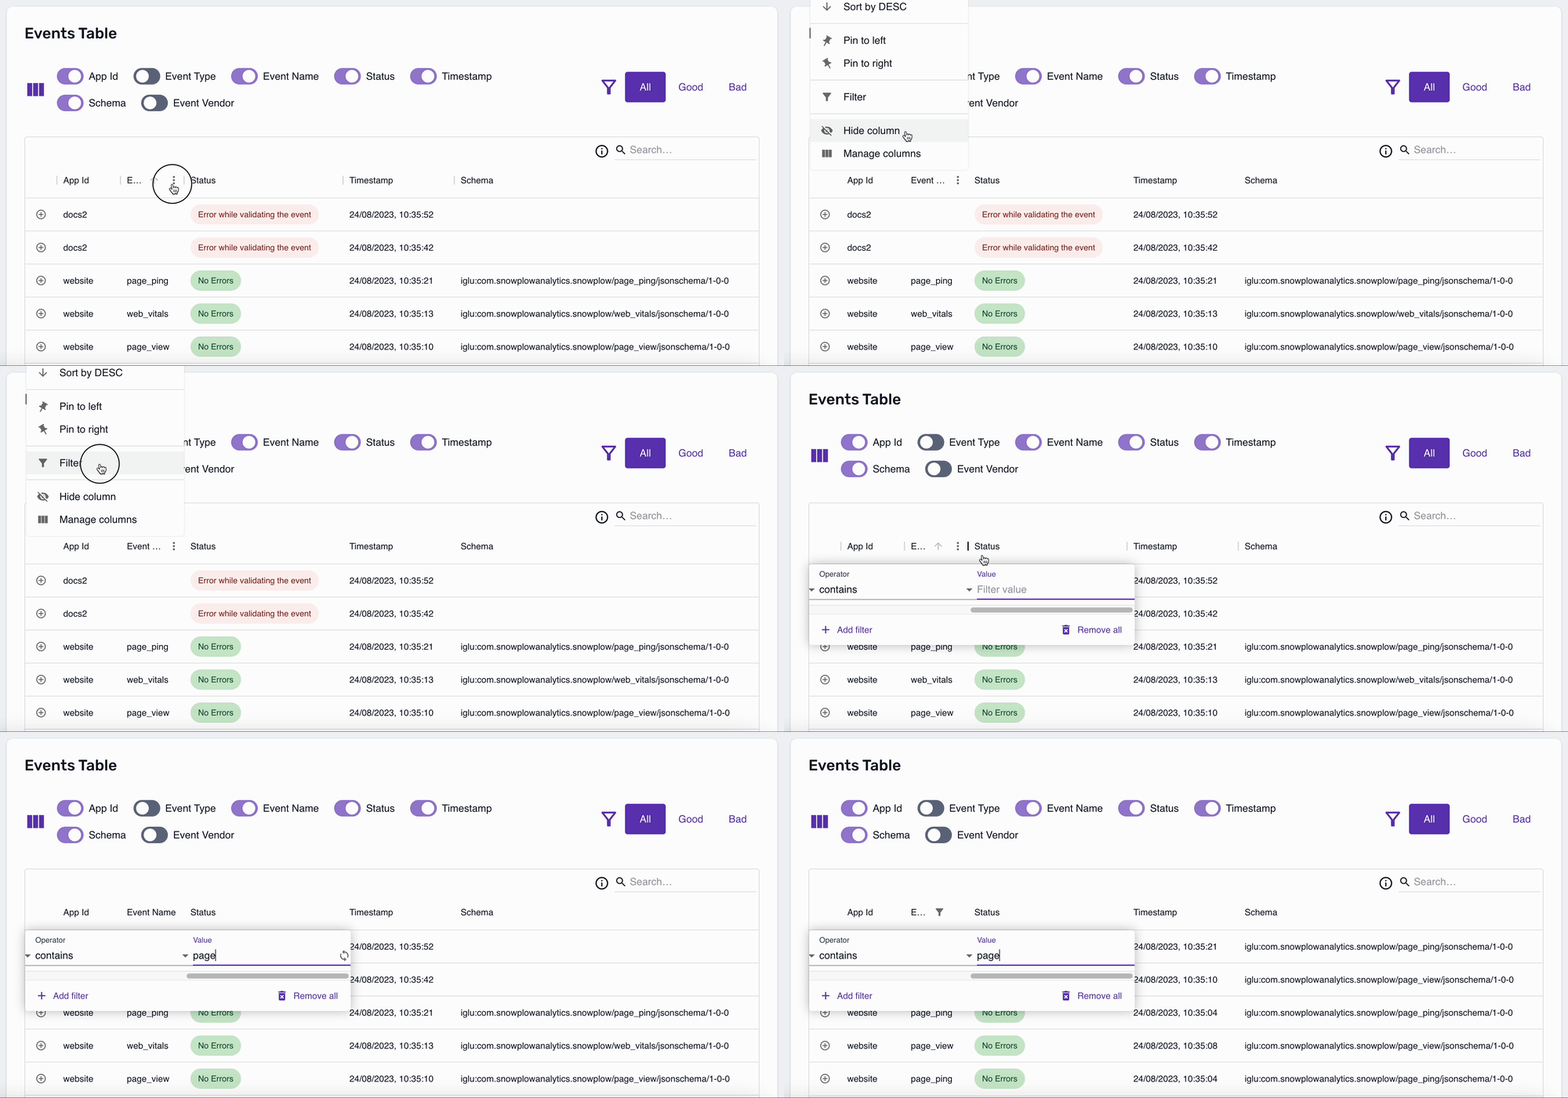
Finally, you can filter each column:
Exploring event details
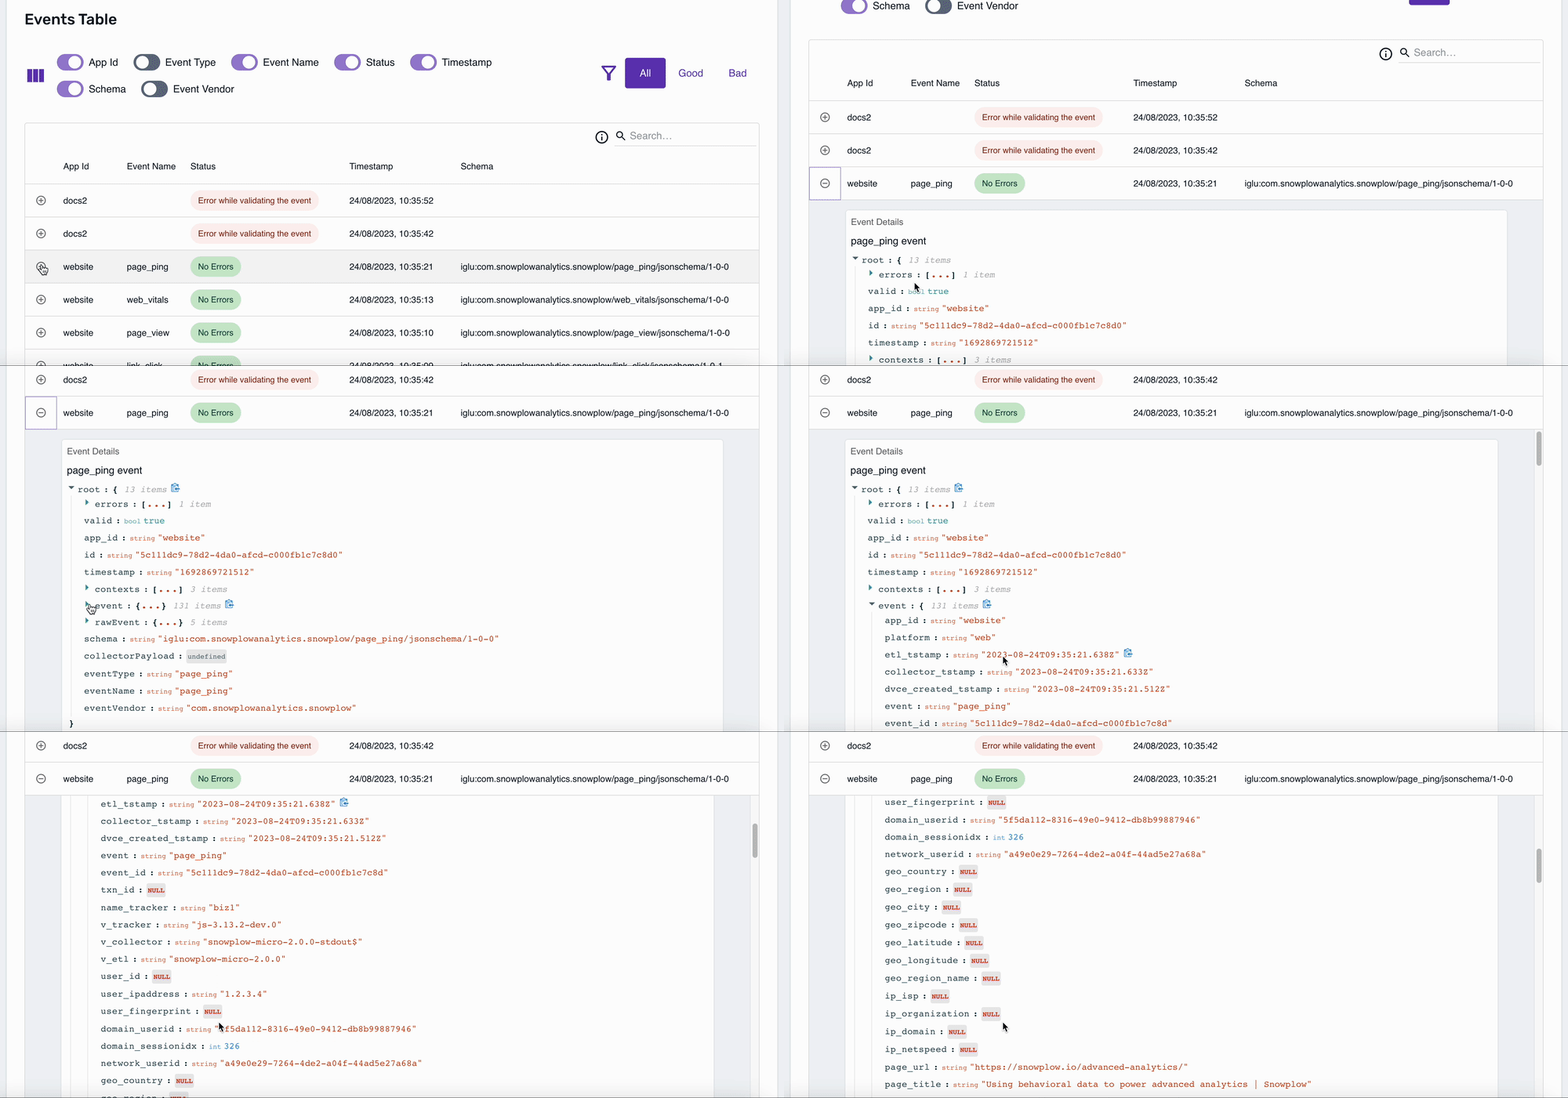
For valid events, you can expand the row to look at all the event fields in JSON:
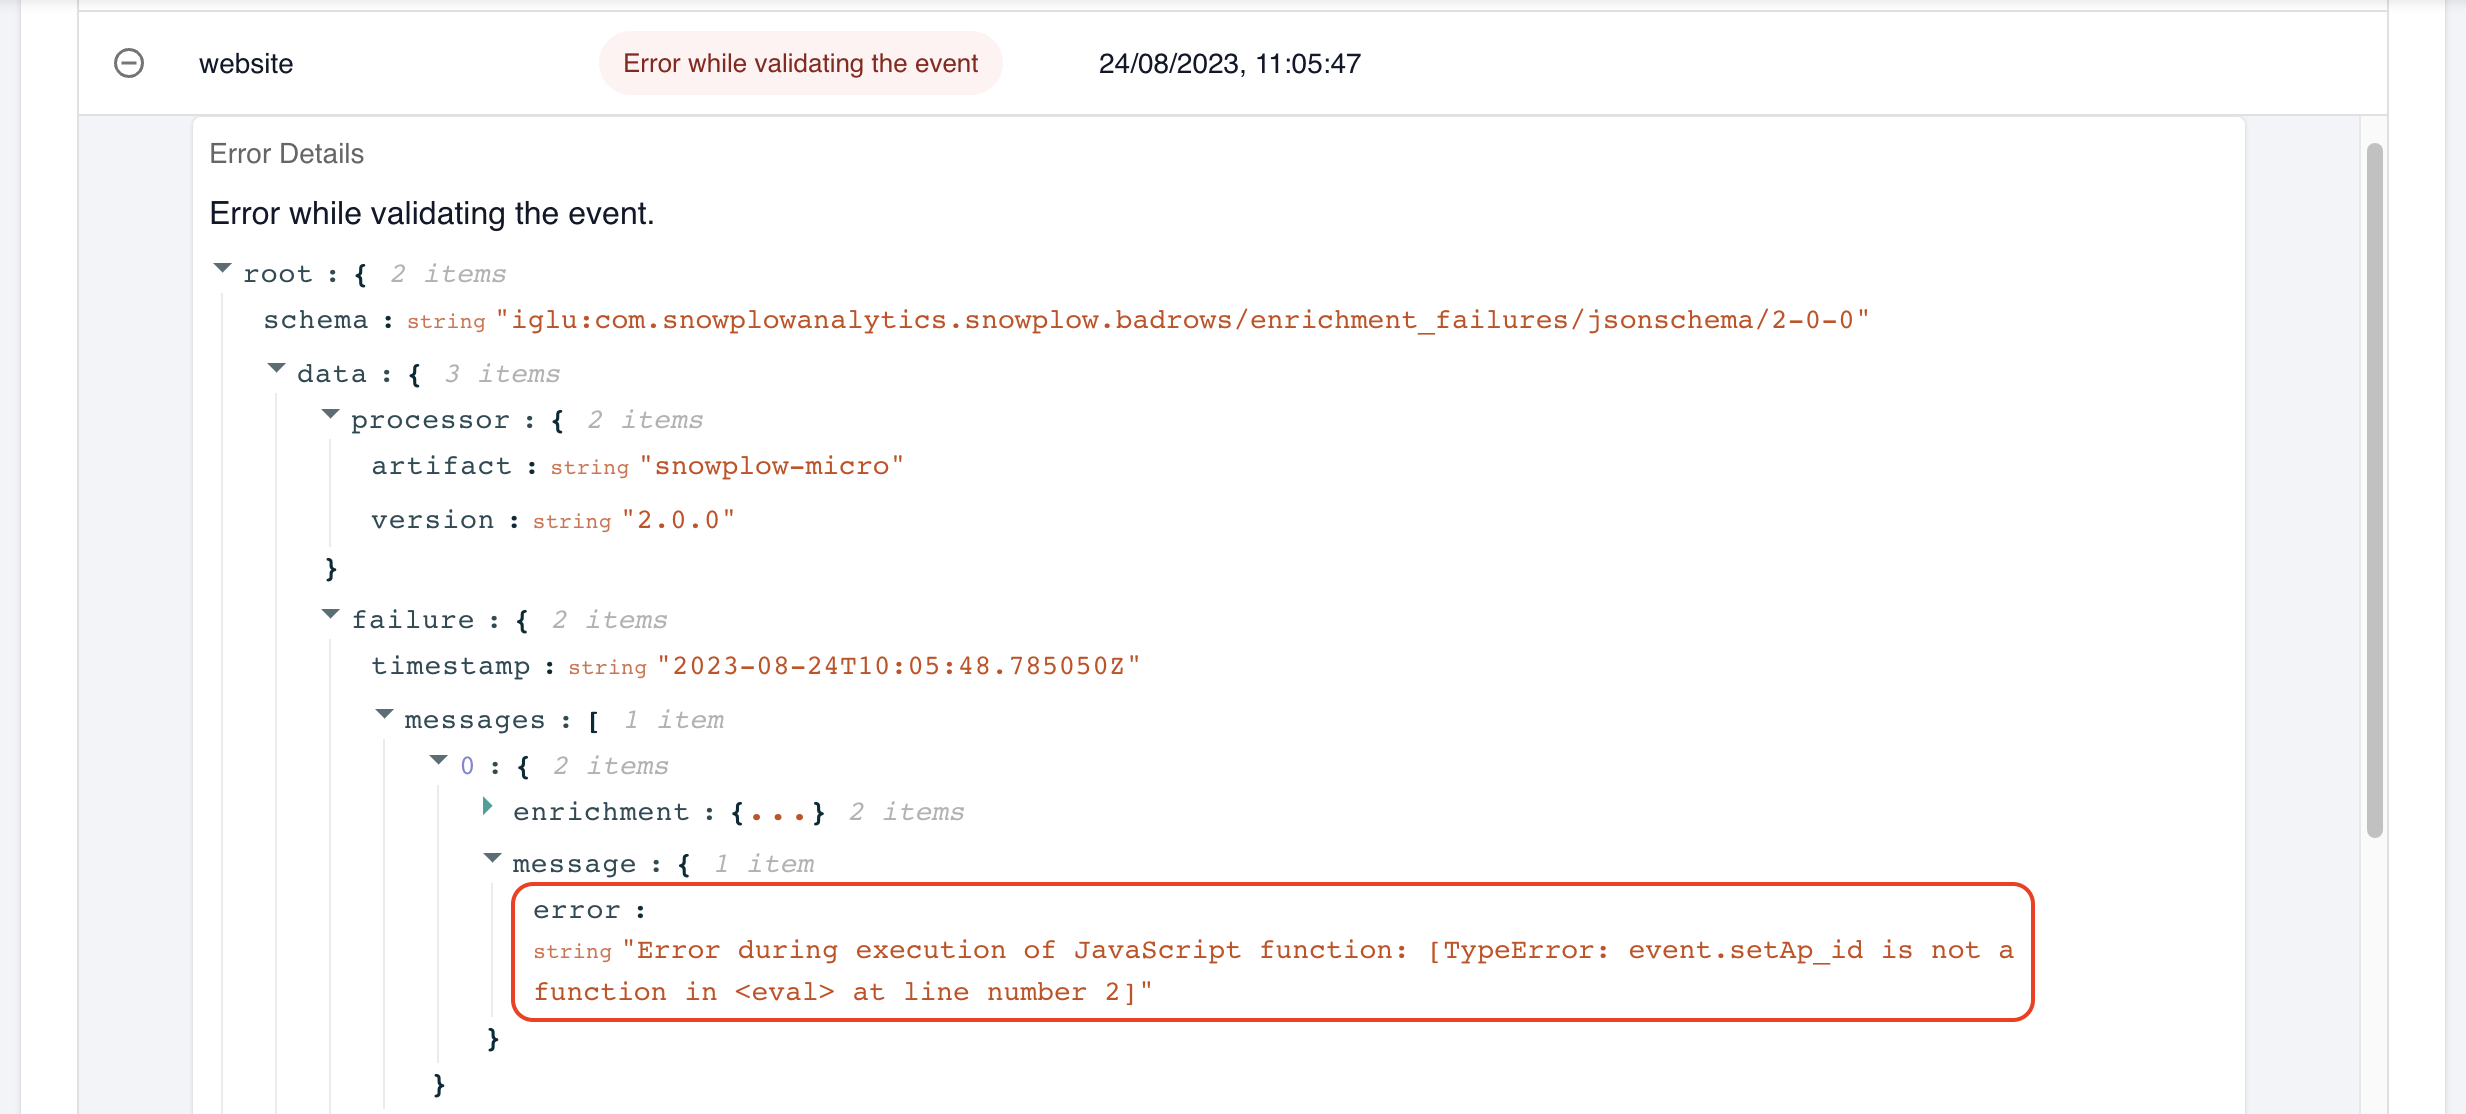
Equally, for failed events, you can explore the failure message:
