Marketing Dashboards
👉 Take me there! 👈
Introduction
This guide is written to introduce you to the dashboard templates designed for visualizing your derived tables produced by the snowplow-web dbt package. It will show you how to get started and what each visualization view represents.
Each tool has it's own definition of what defines a view, page, tab, dashboard etc. We will use these terms interchangeably throughout.
Dashboards
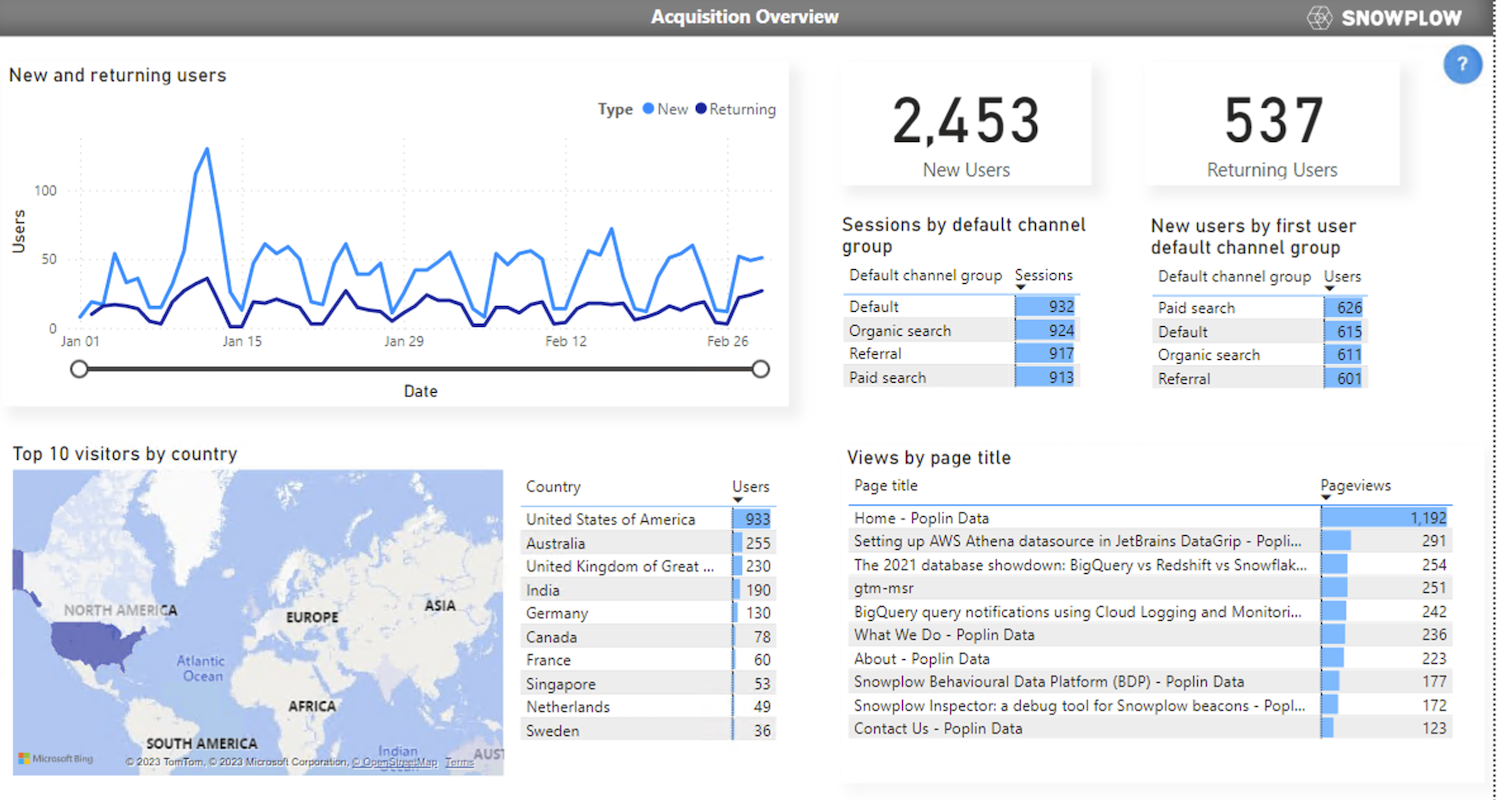
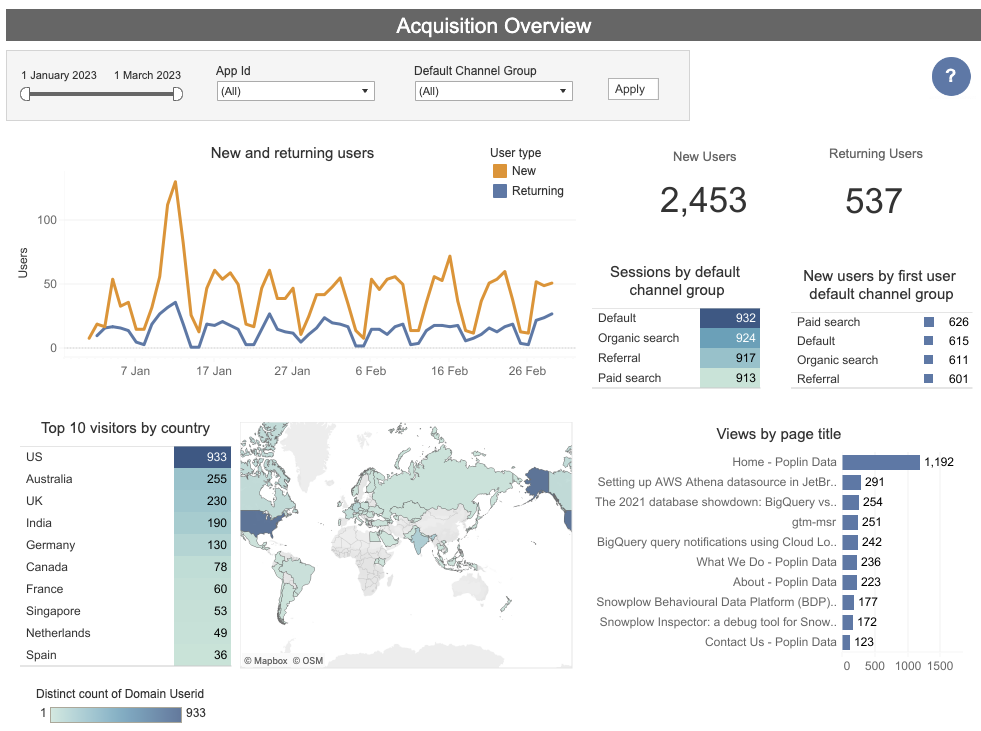
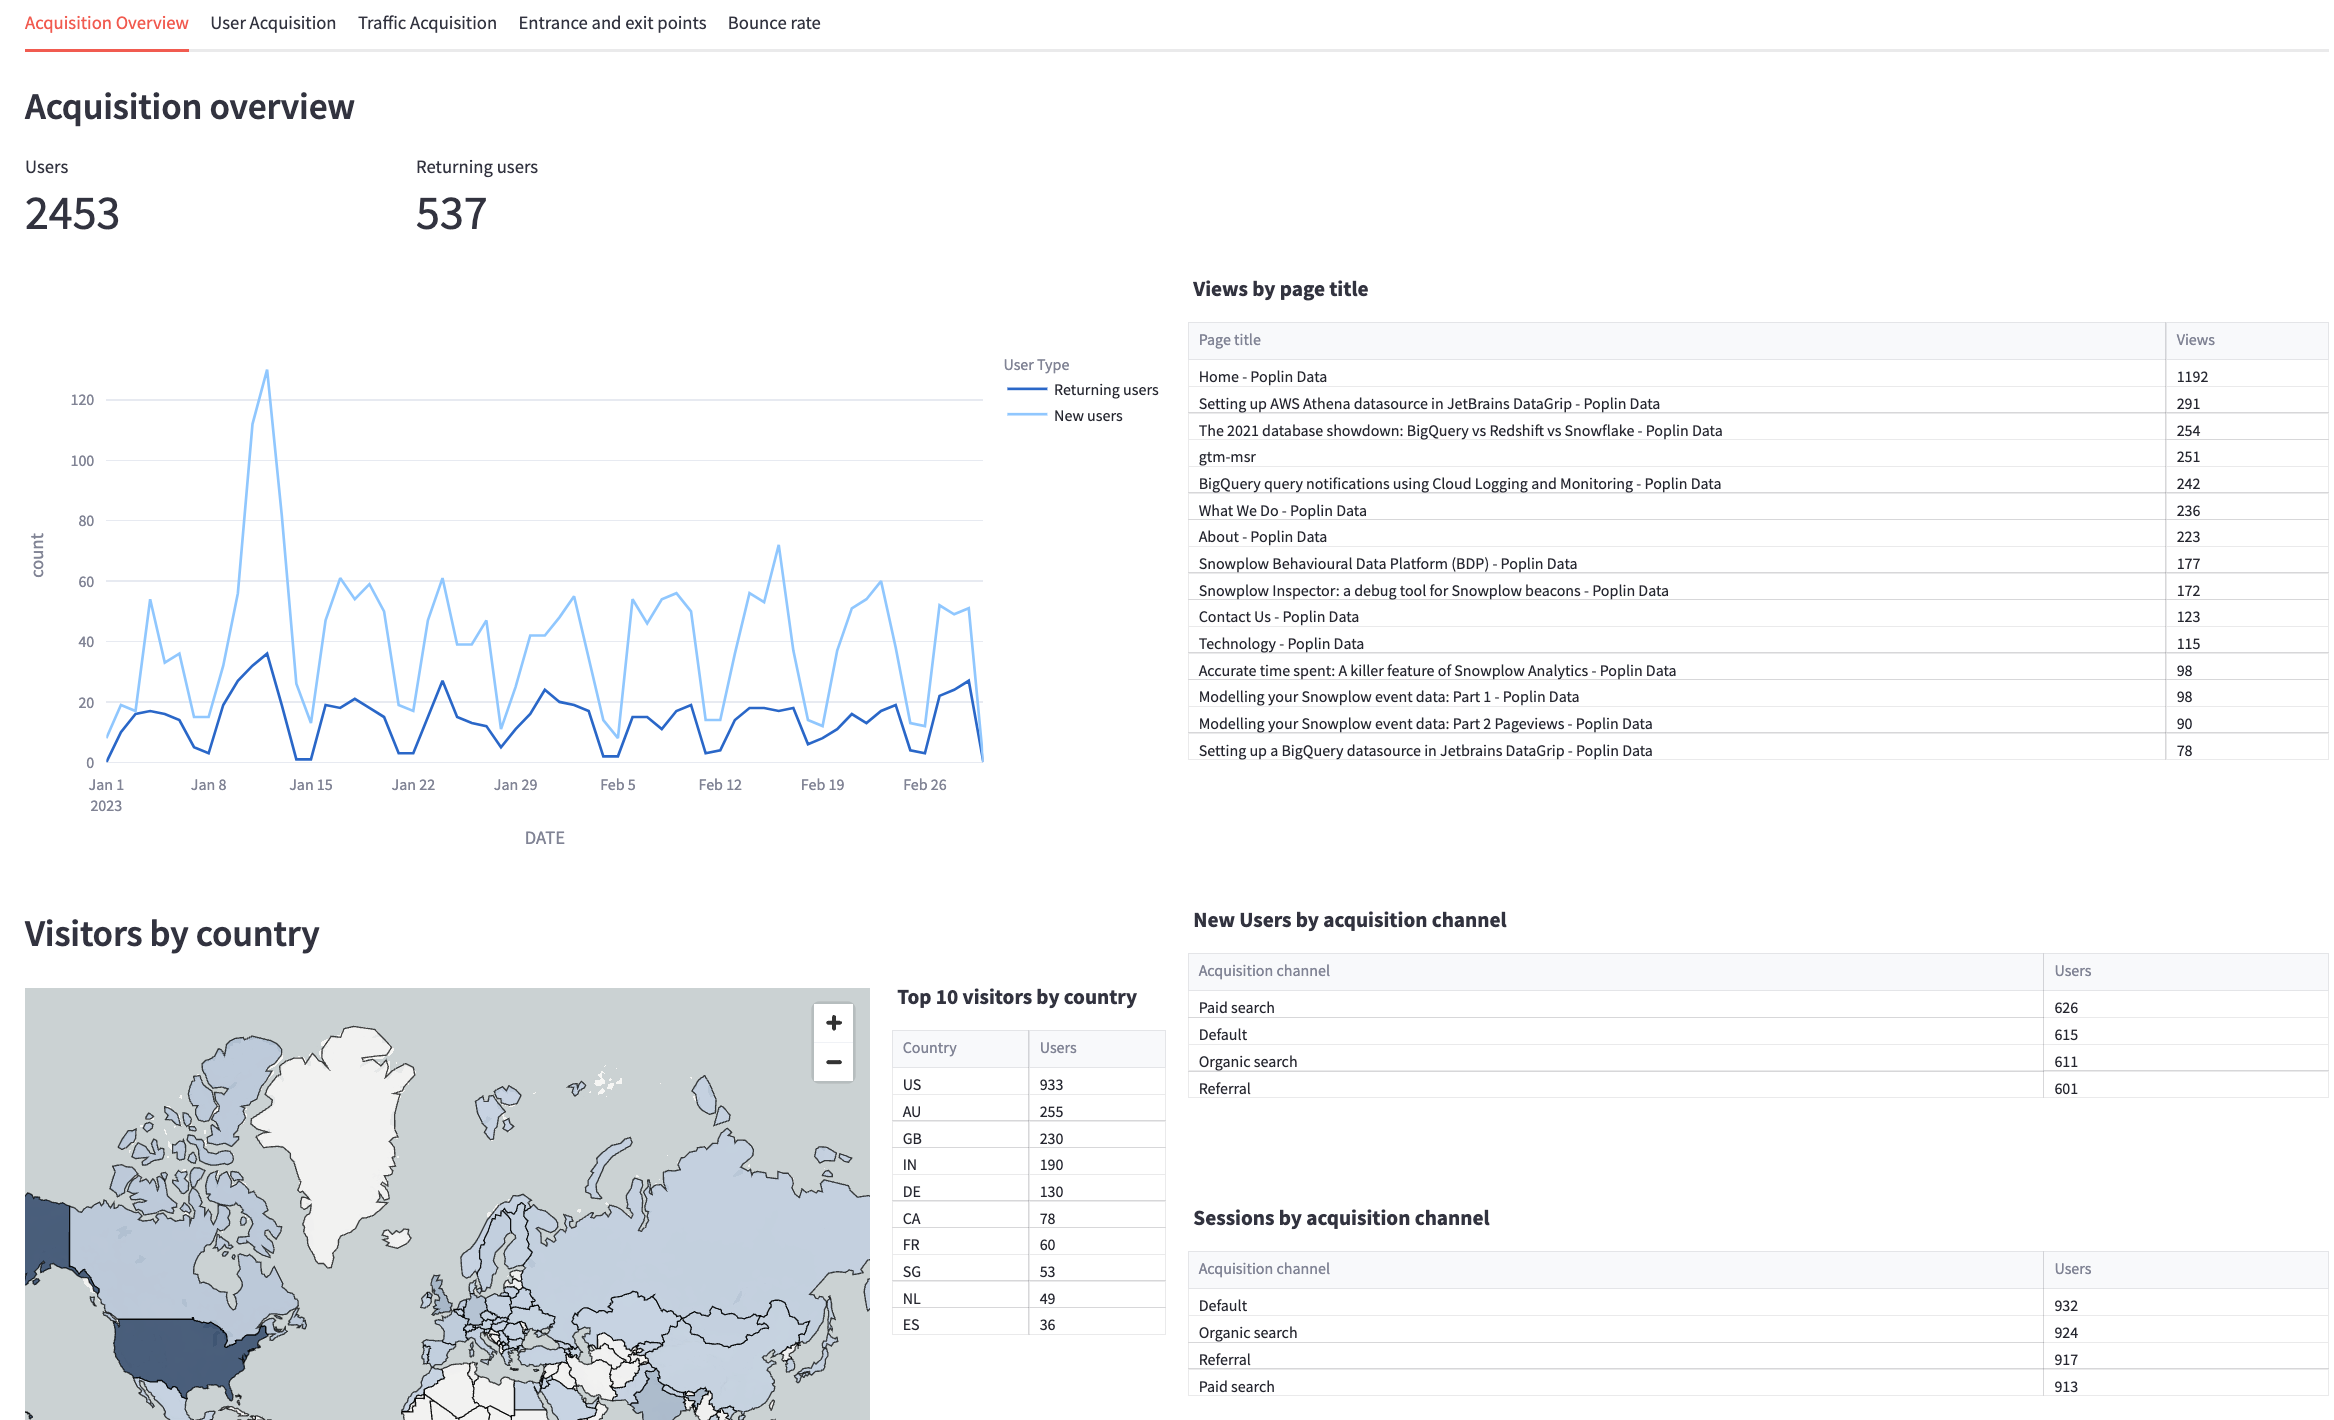
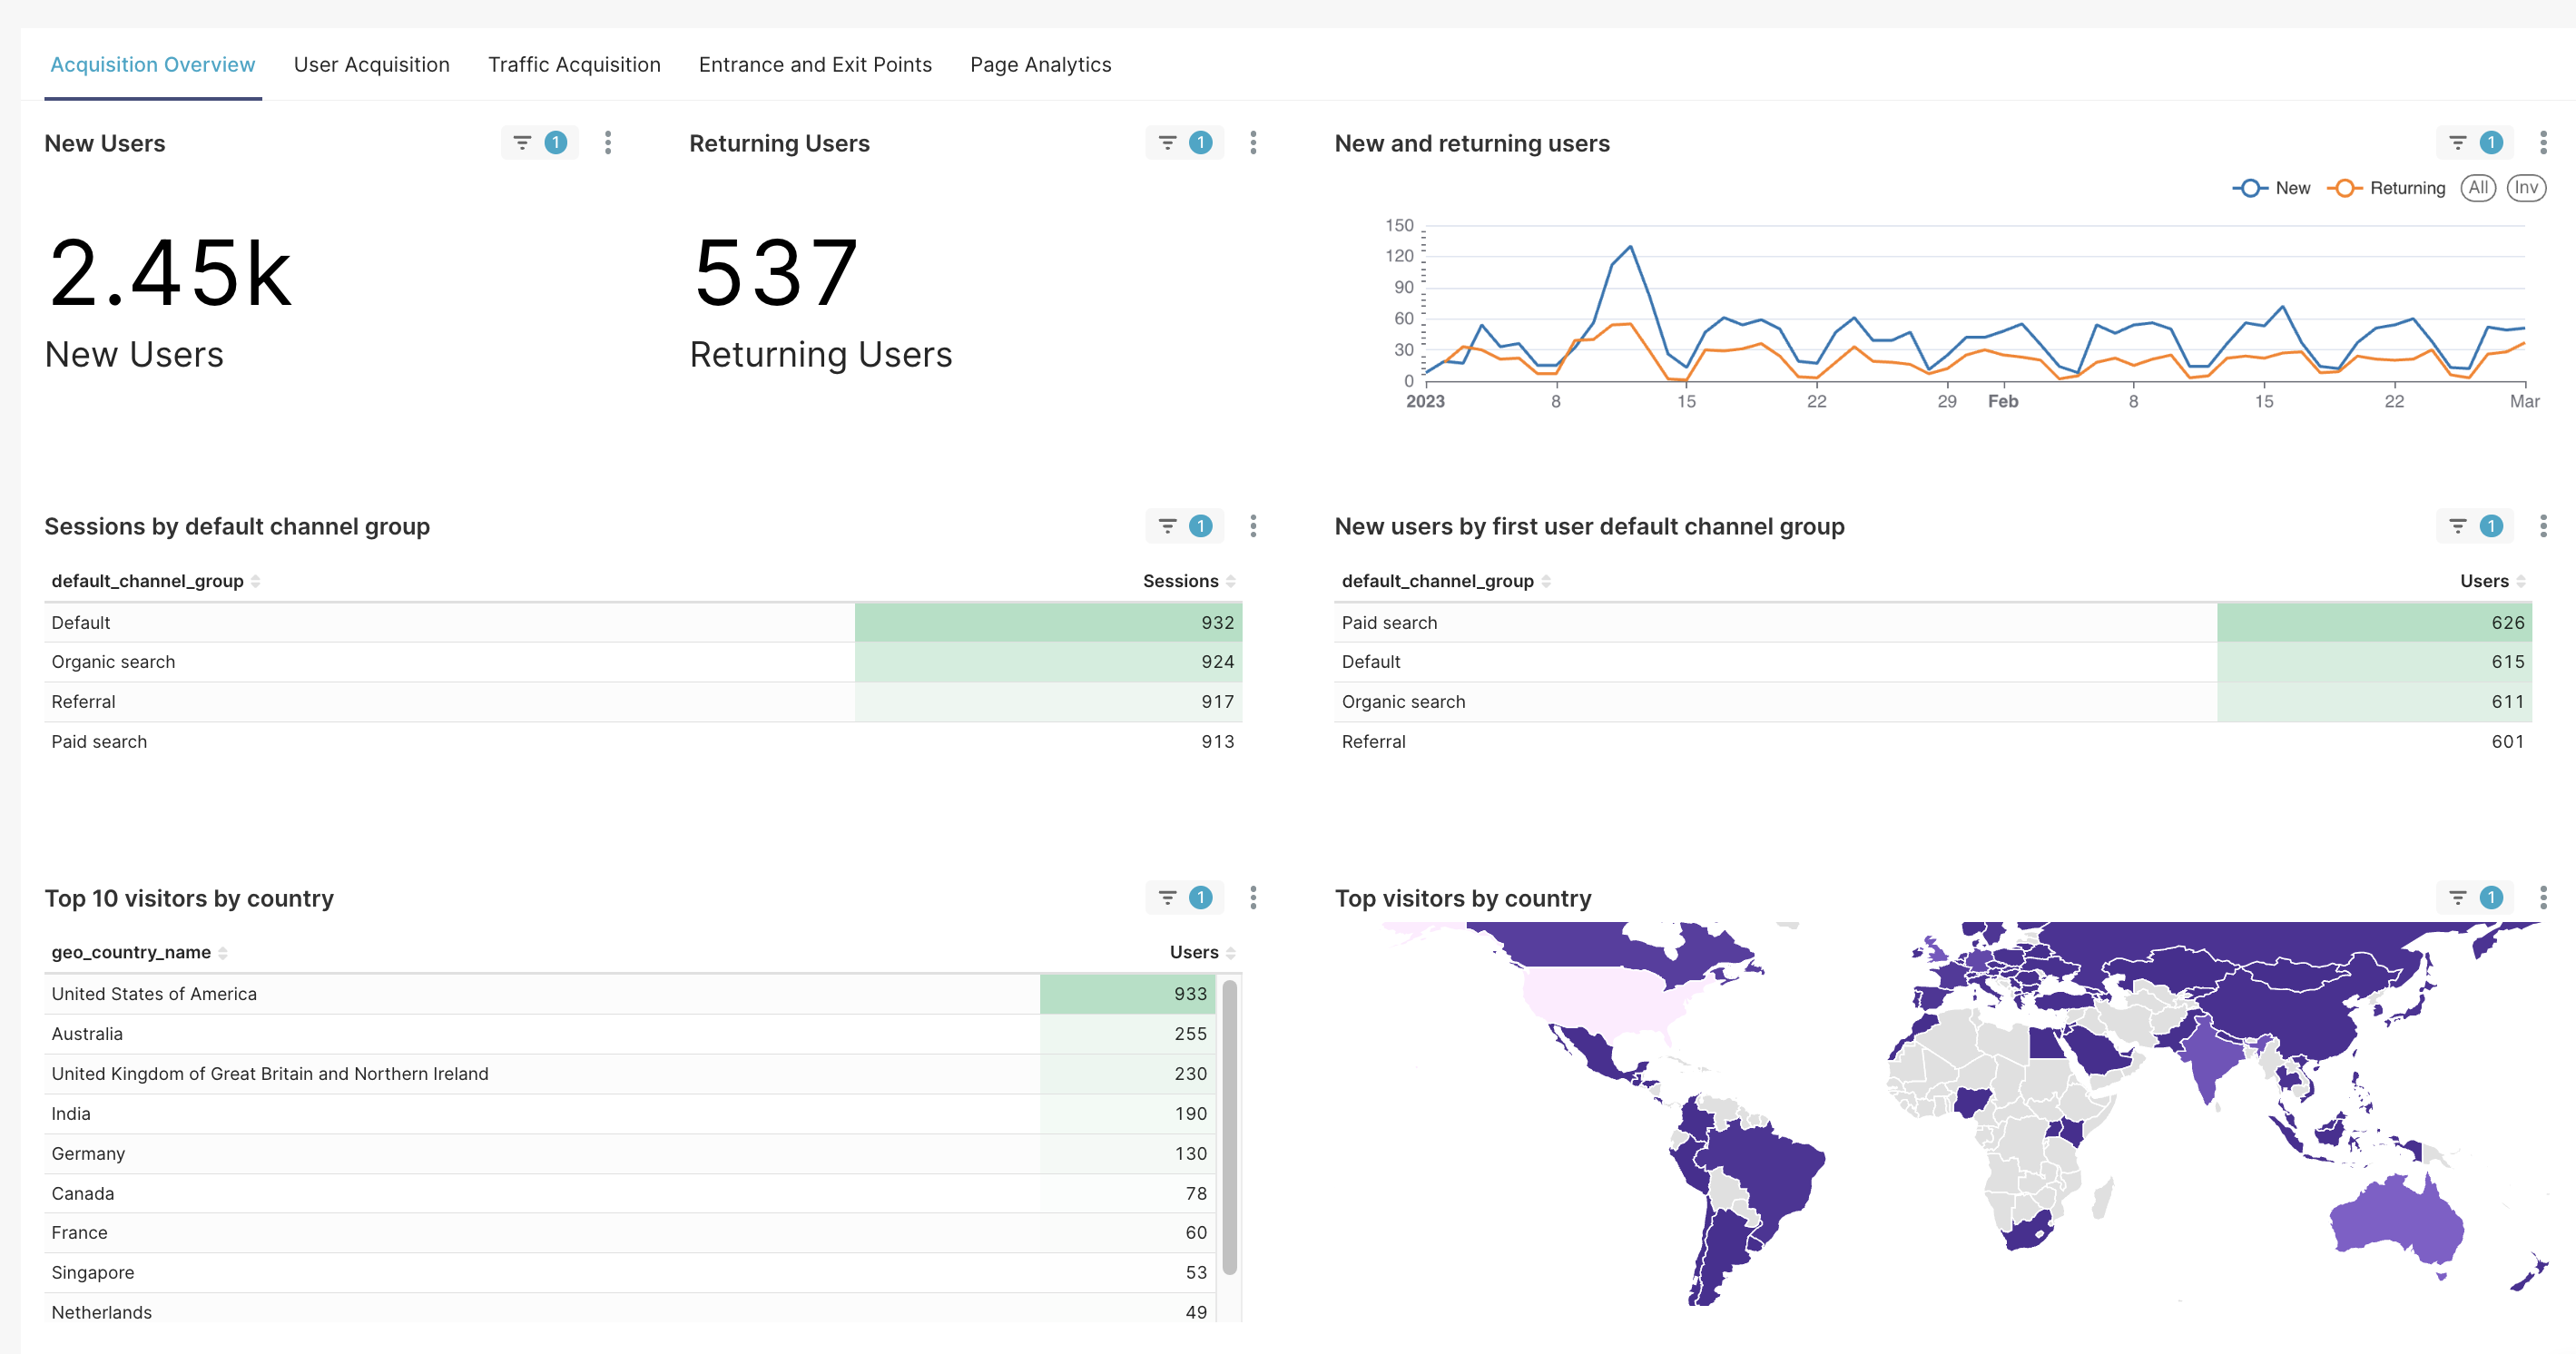
Acquisition Overview
The Acquisition Overview provides an overview on the website traffic, with a breakdown by marketing channels.
There is also a distinction between New Users who have not previously had a session on the website (domain_sessionid = 1) and Existing users who have a session with domain_sessionidx > 1.
- PowerBI
- Tableau
- Streamlit
- Preset
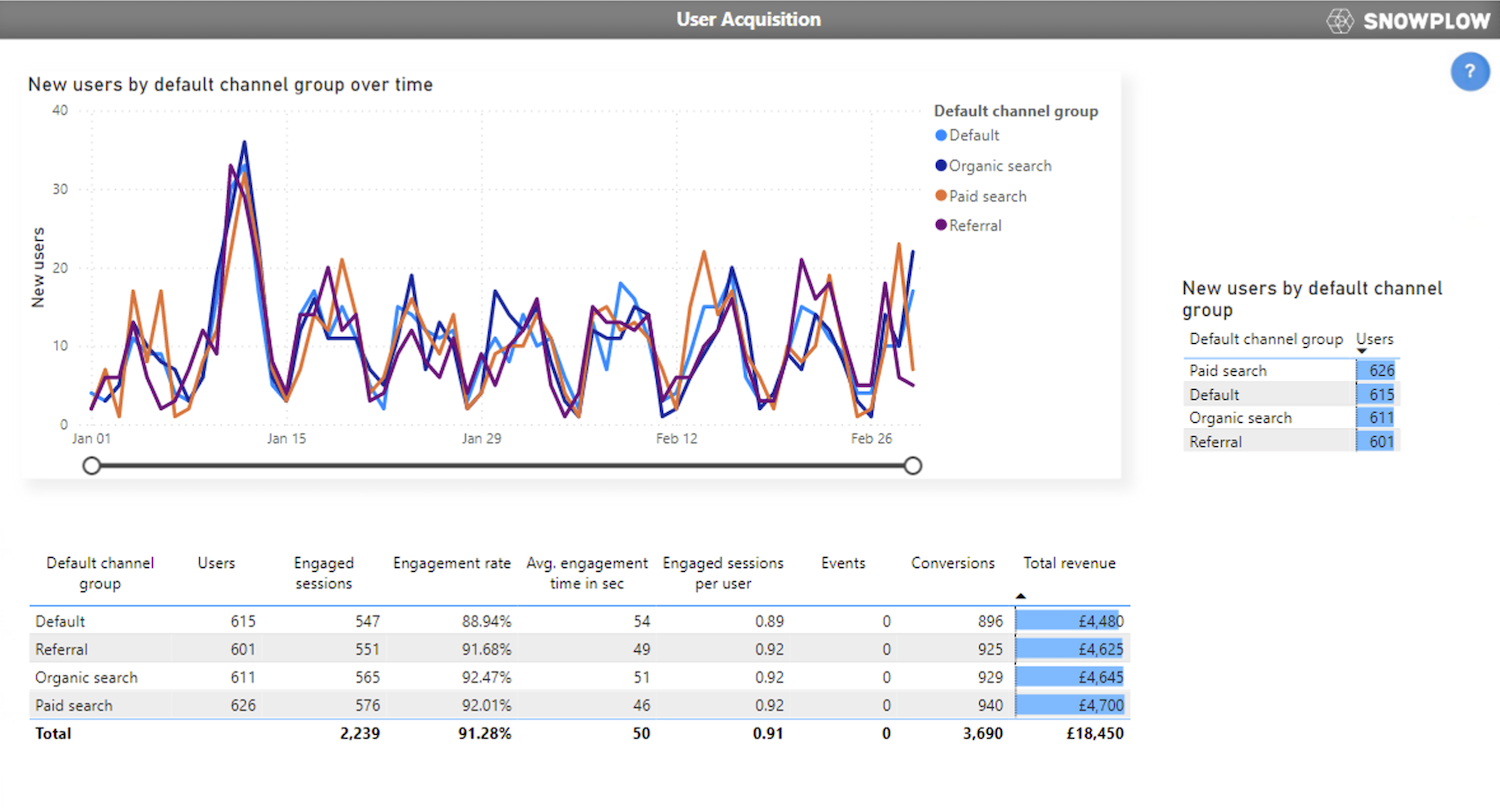
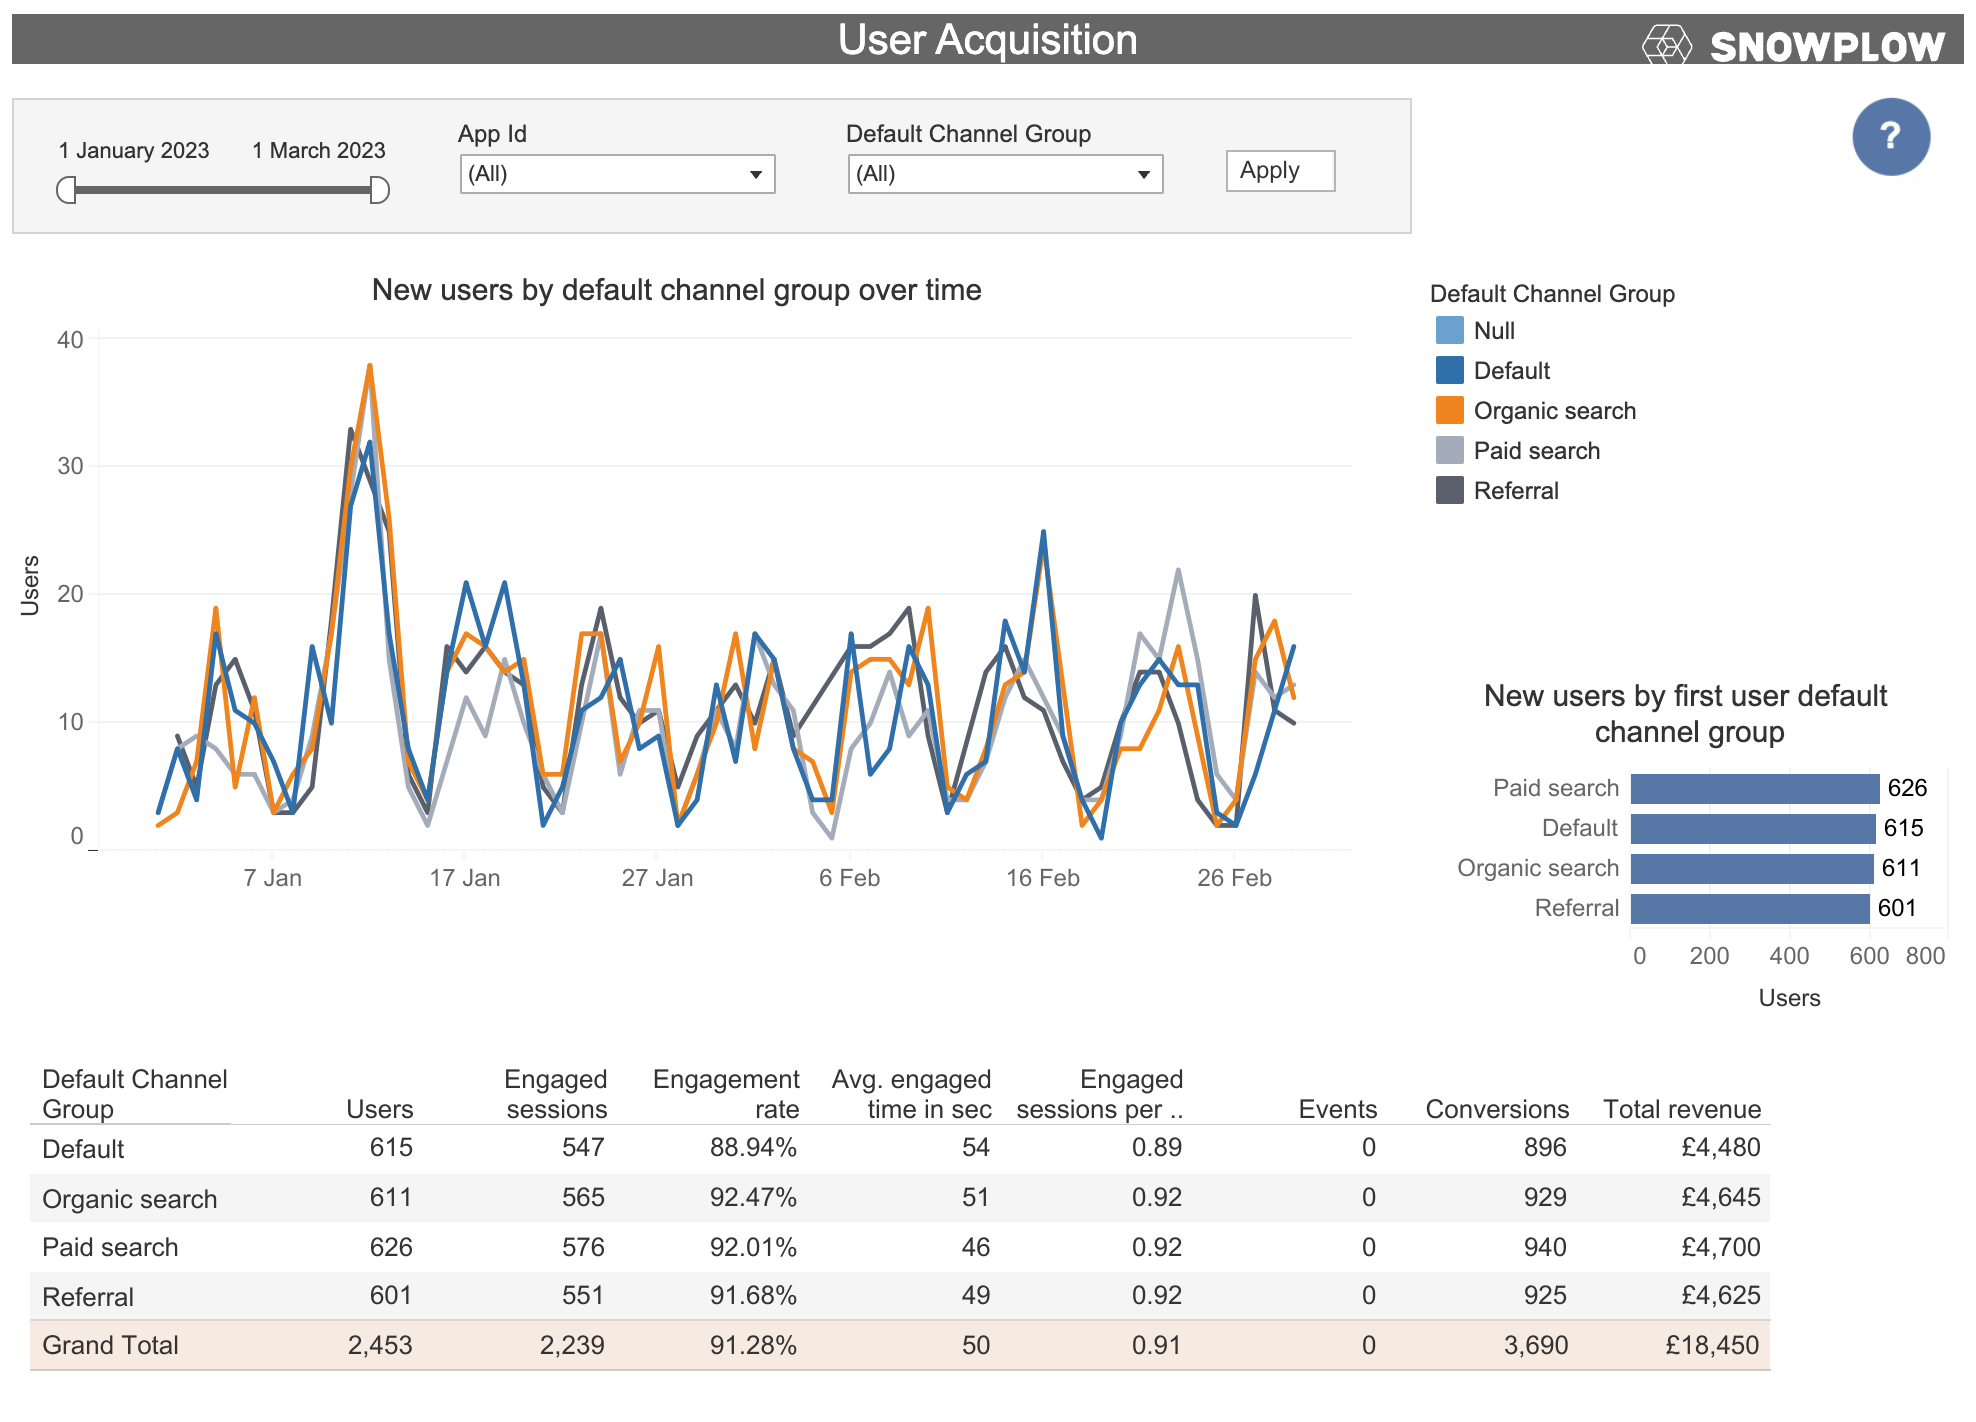
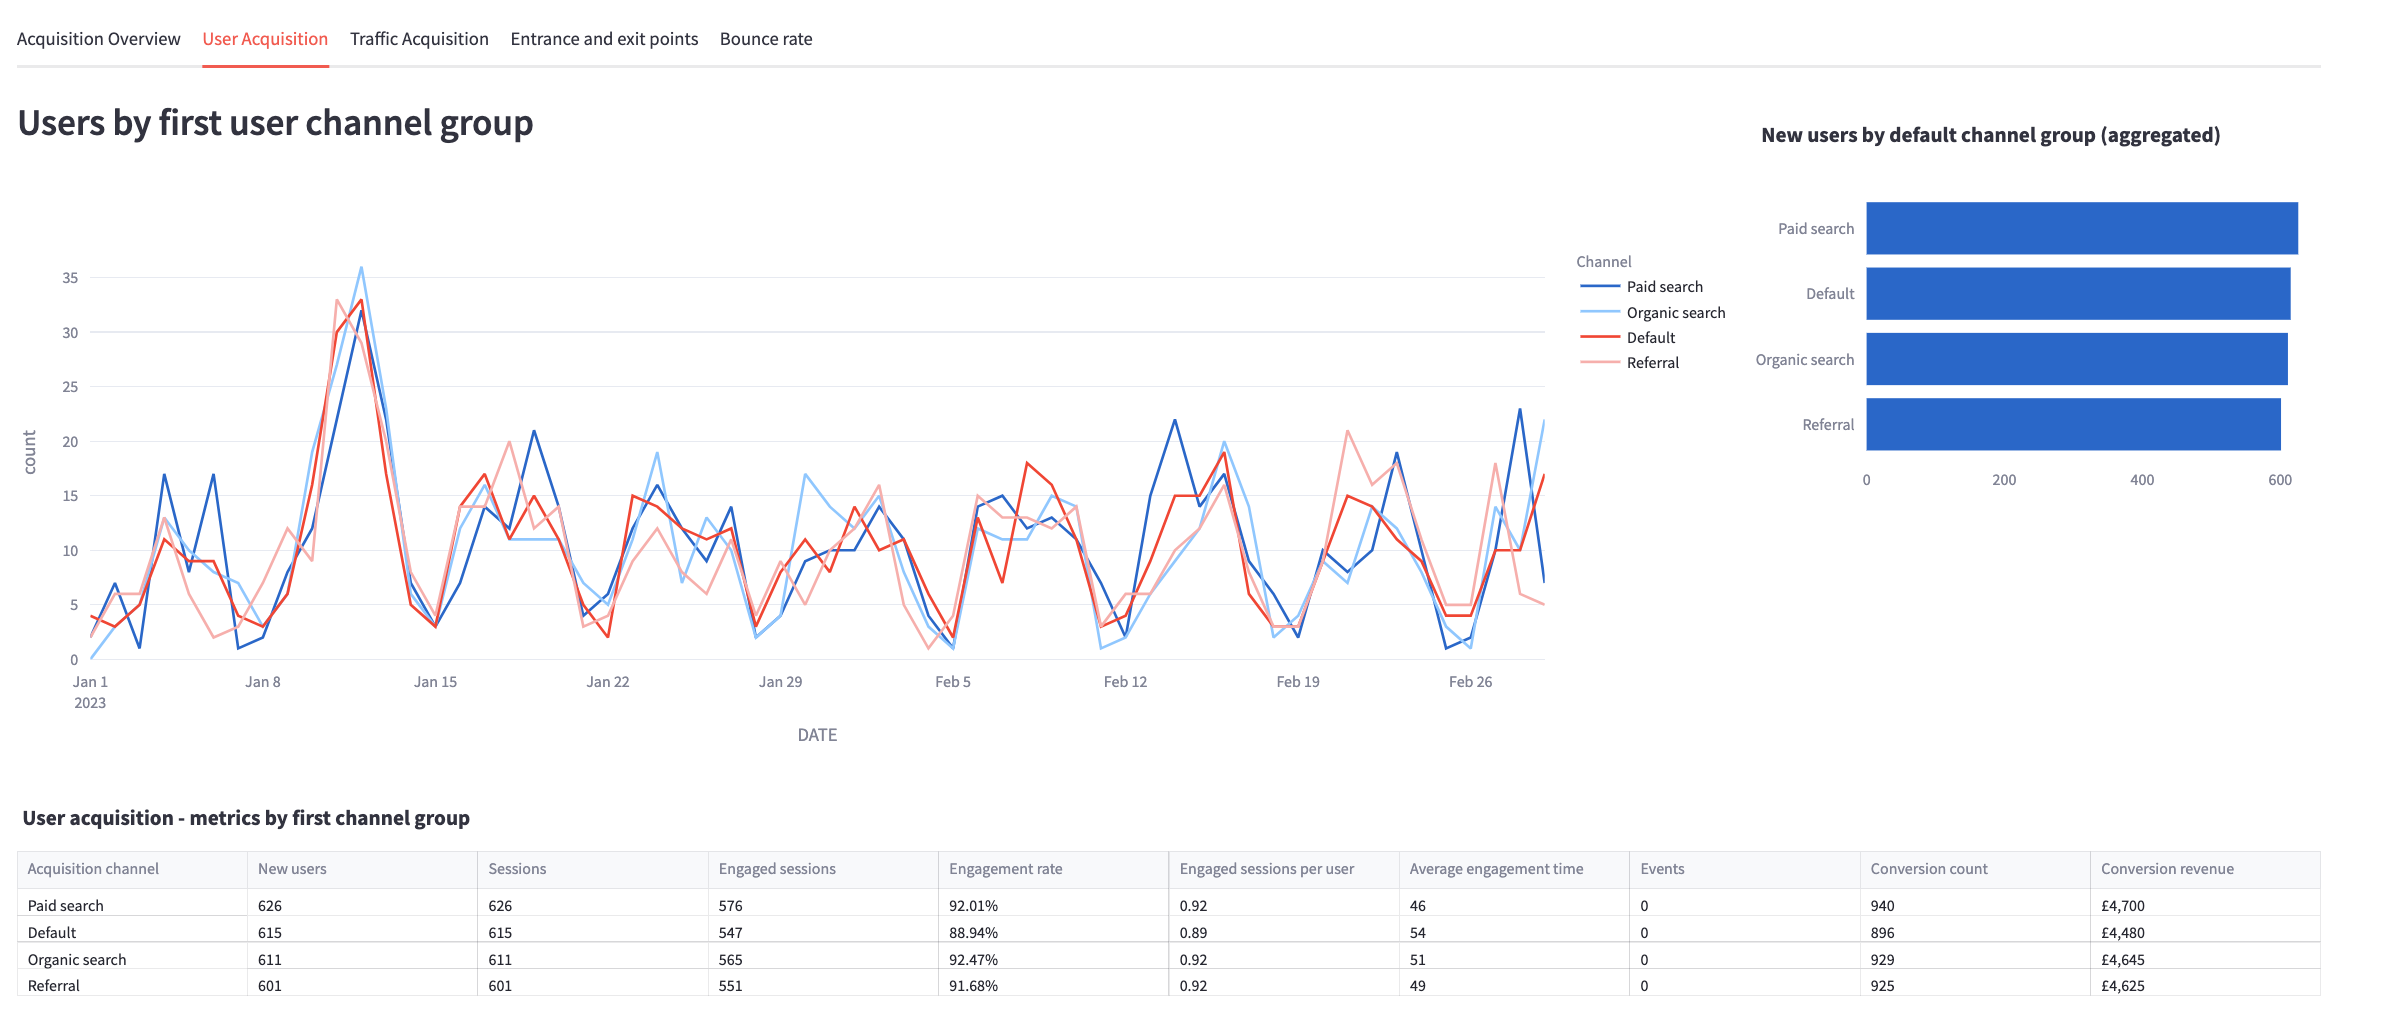
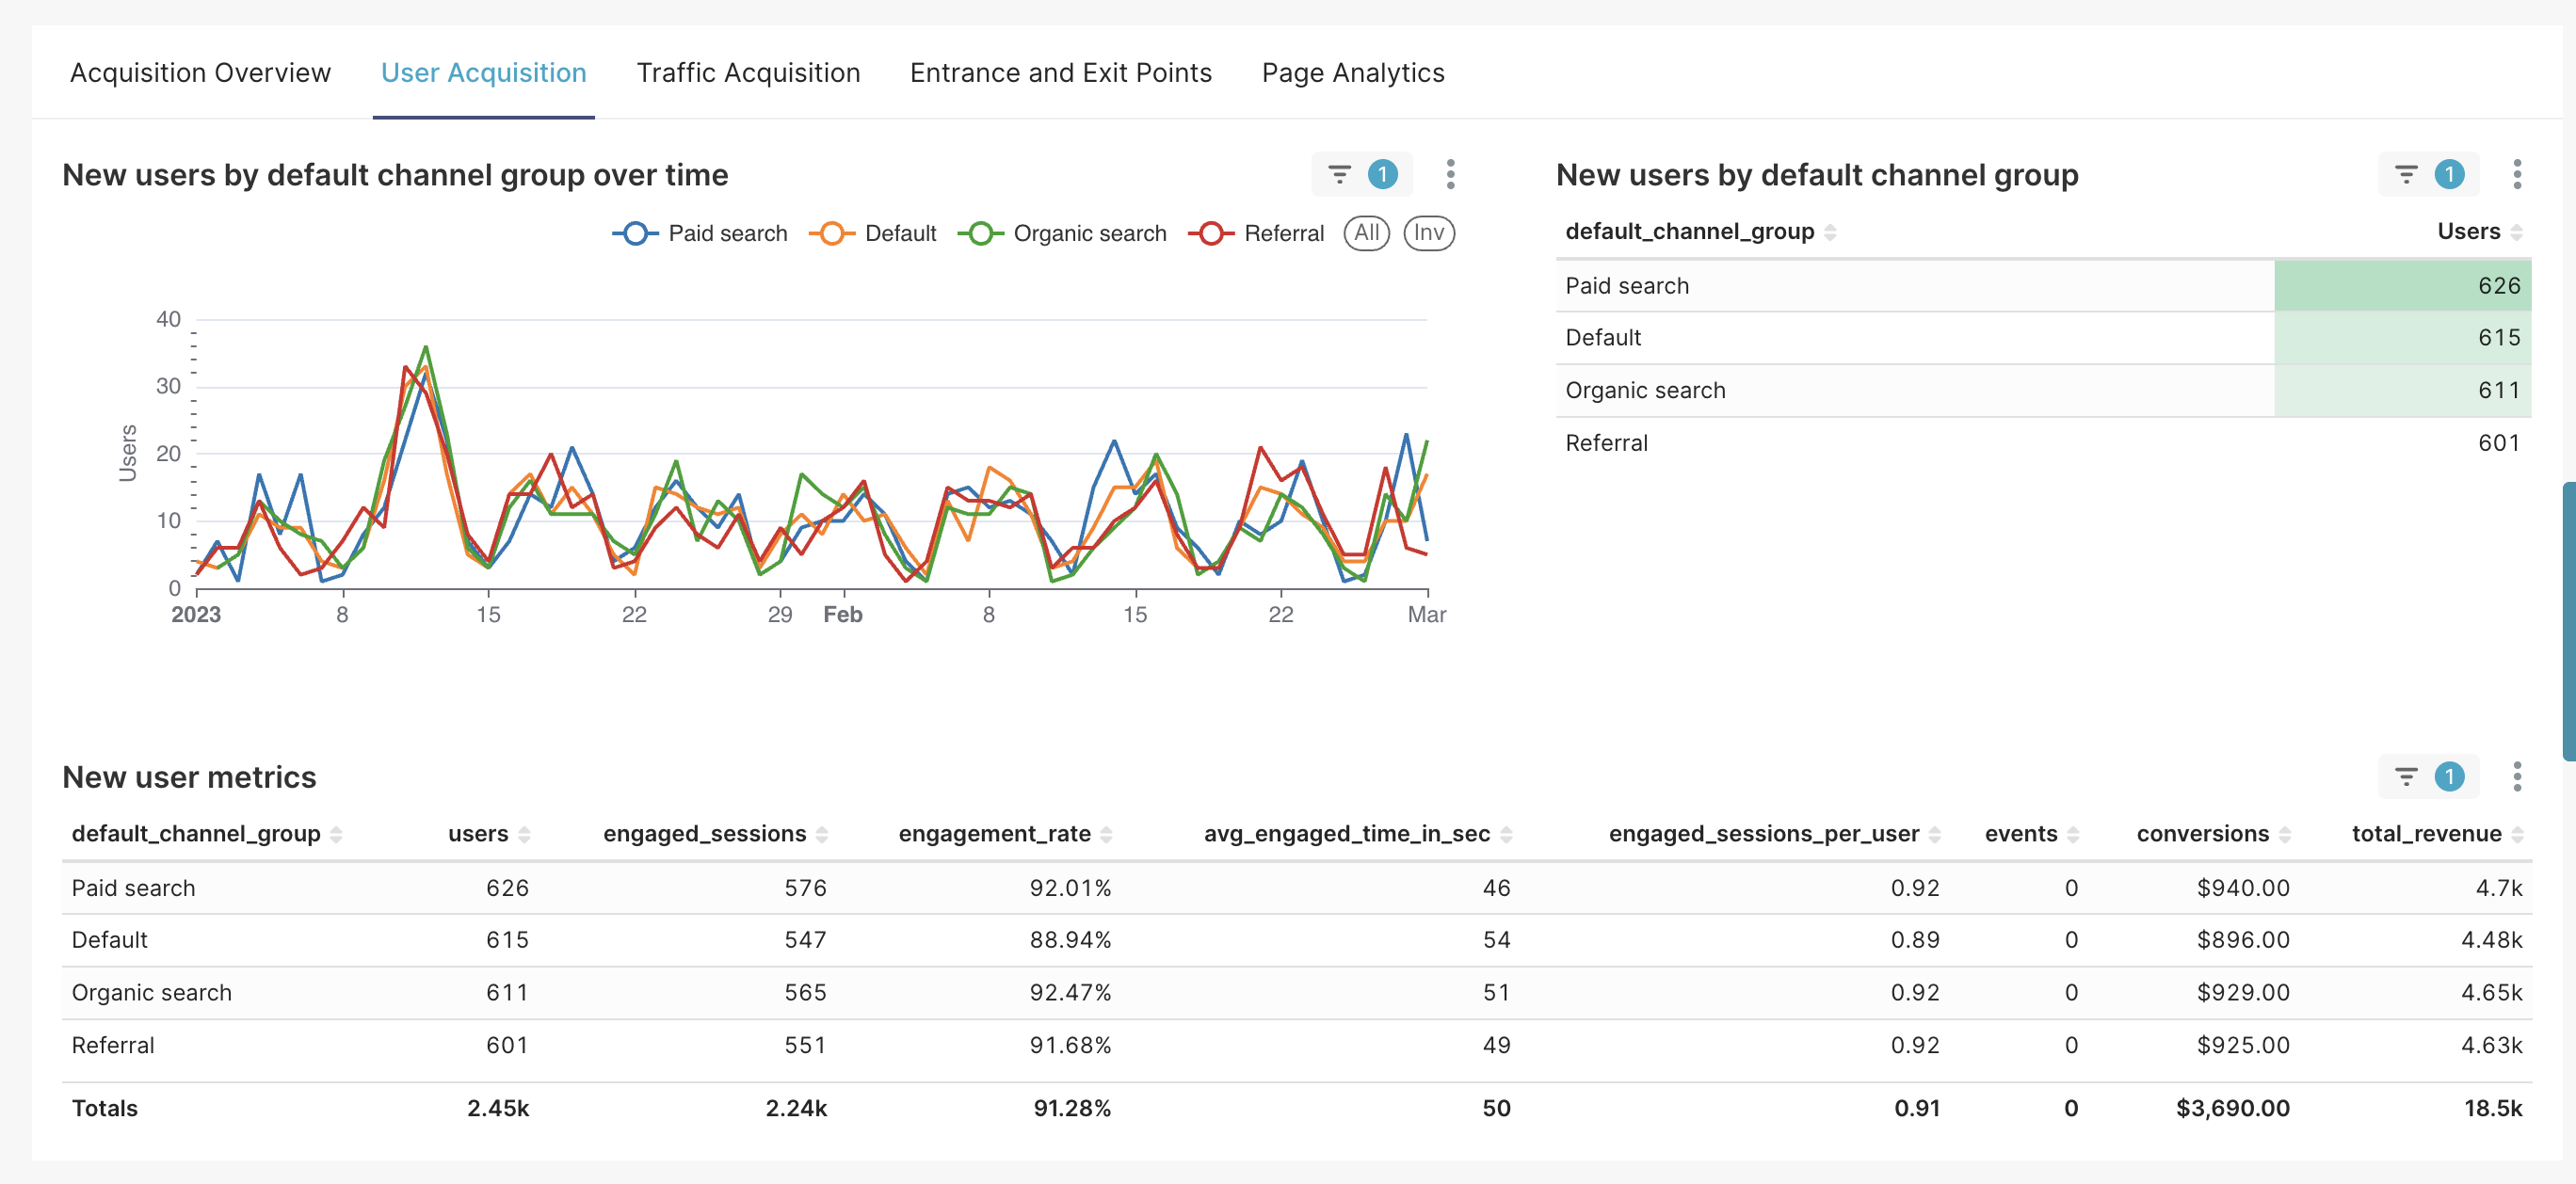
User Acquisition
This view is about User Acquisition which is effectively about what channels / methods were used to acquire new users.
Every visual is already filtered on new users only (domain_sessionidx = 1).
The metric are defined as:
- engaged_sessions =
count(case when engaged=True end) - engagement_rate =
engaged_sessions / count(distinct domain_sessionid) - conversion_count =
sum(cv__all_volume) - conversion_revenue =
sum(cv__all_total)
- PowerBI
- Tableau
- Streamlit
- Preset
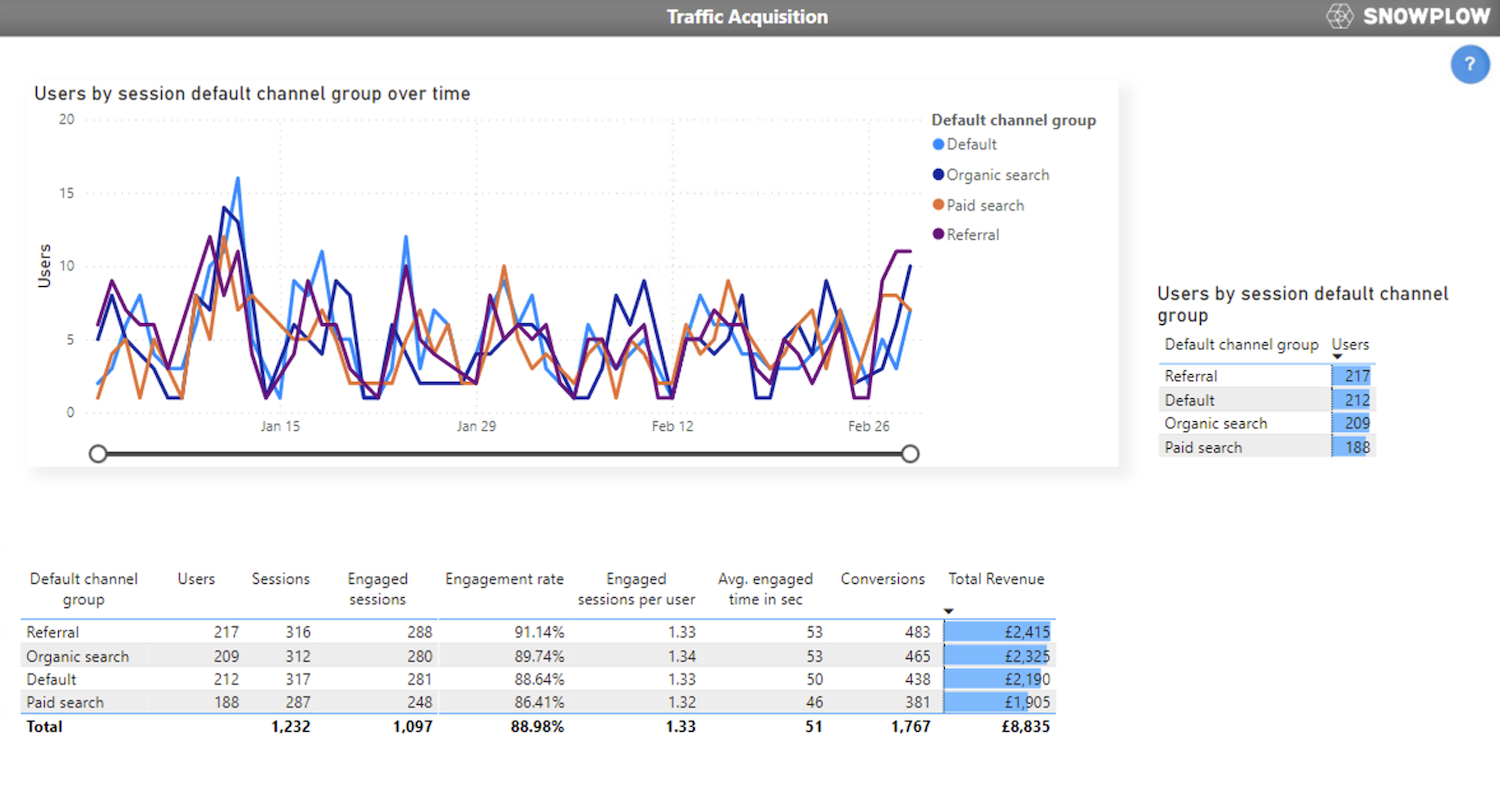
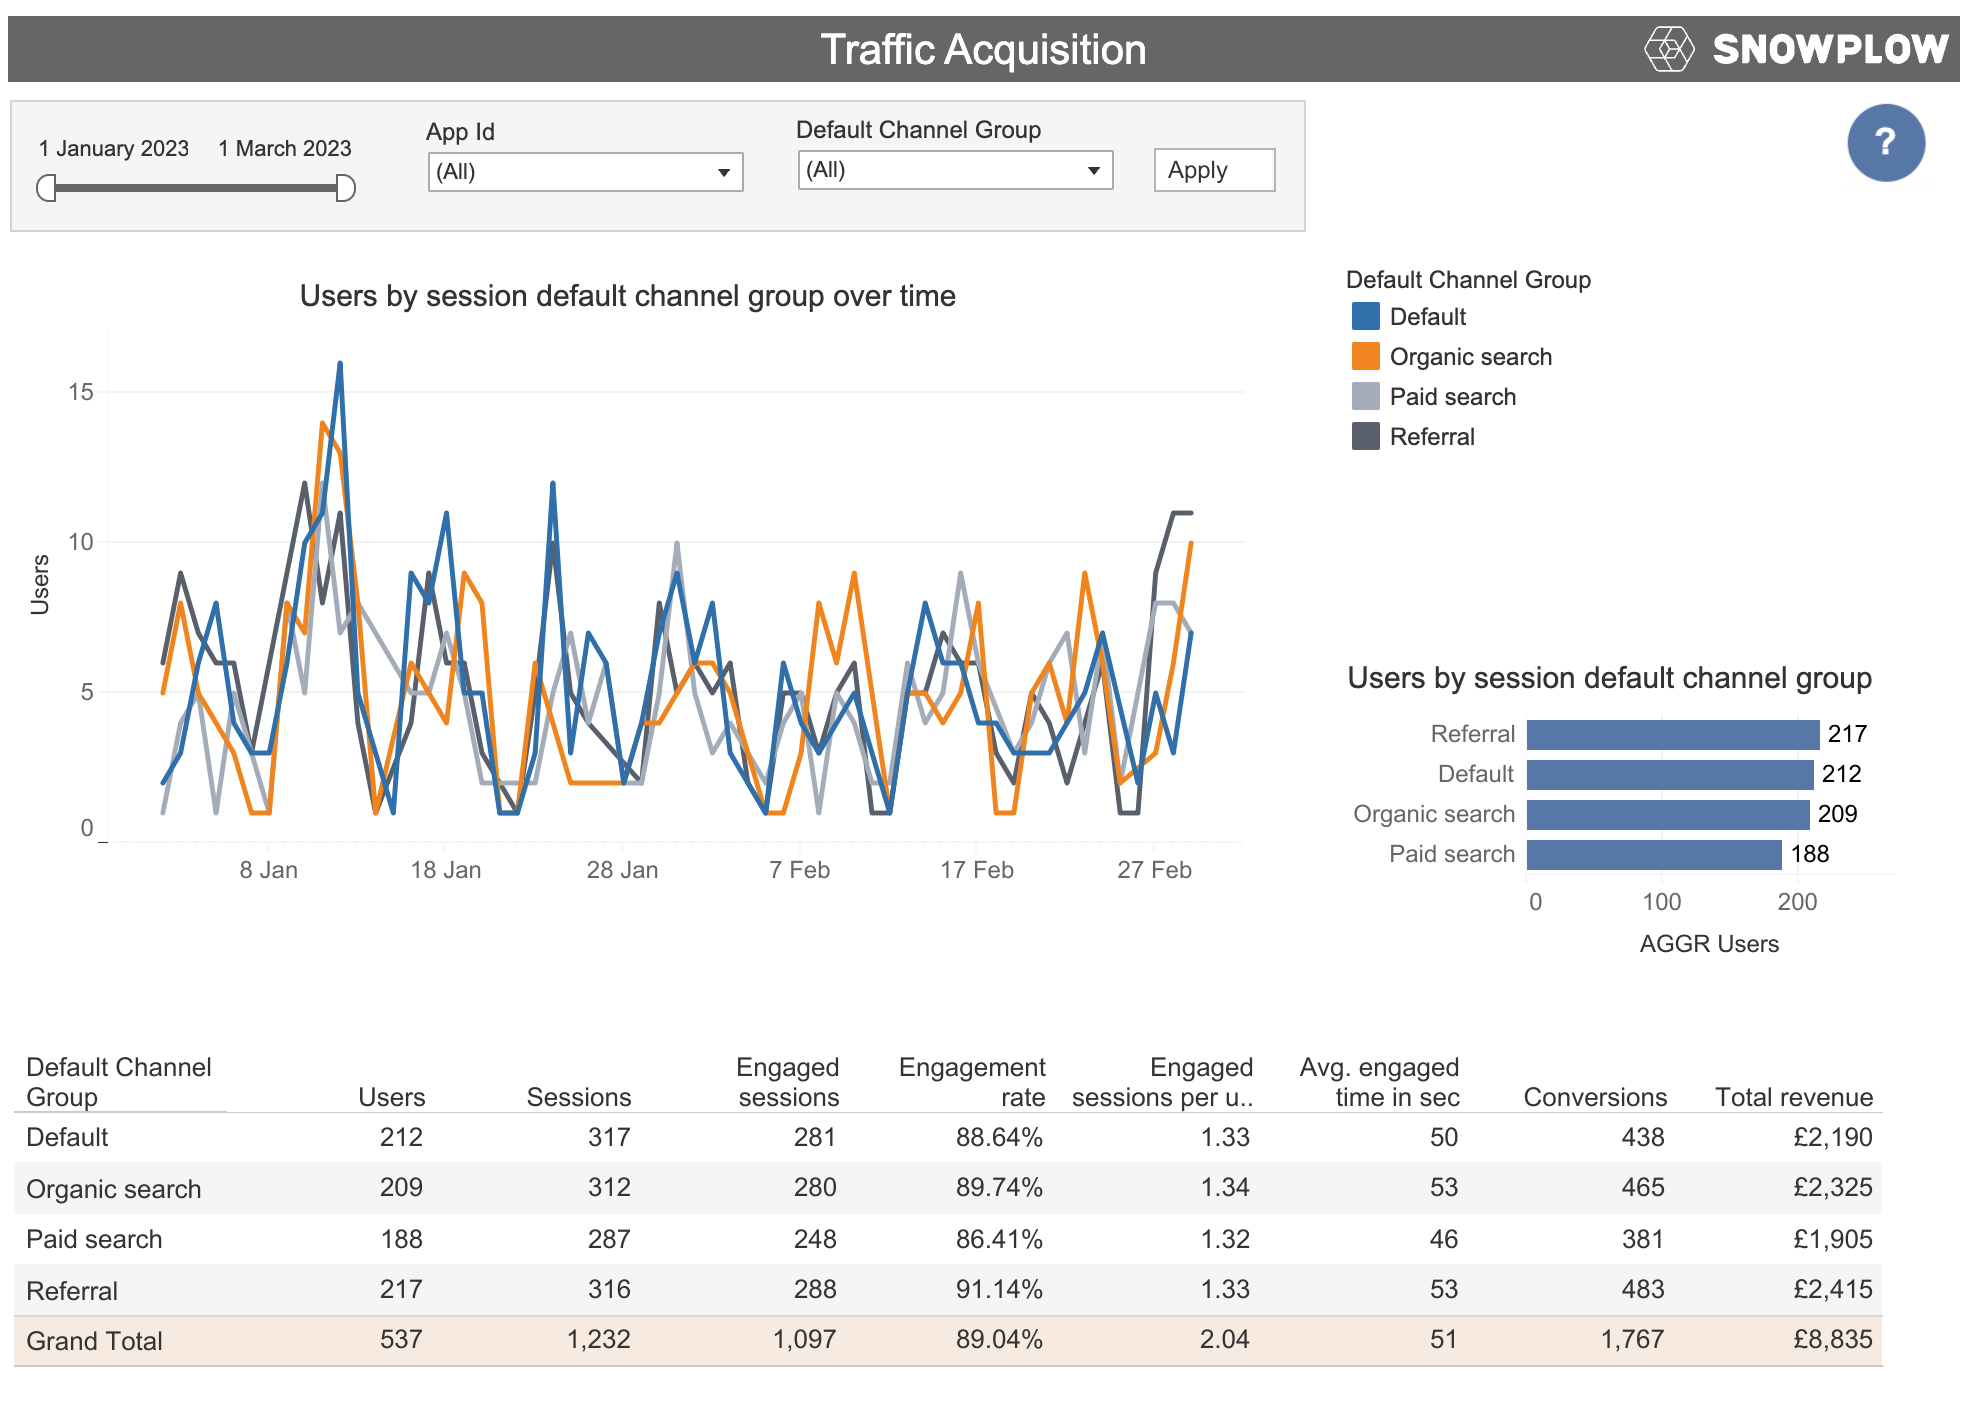
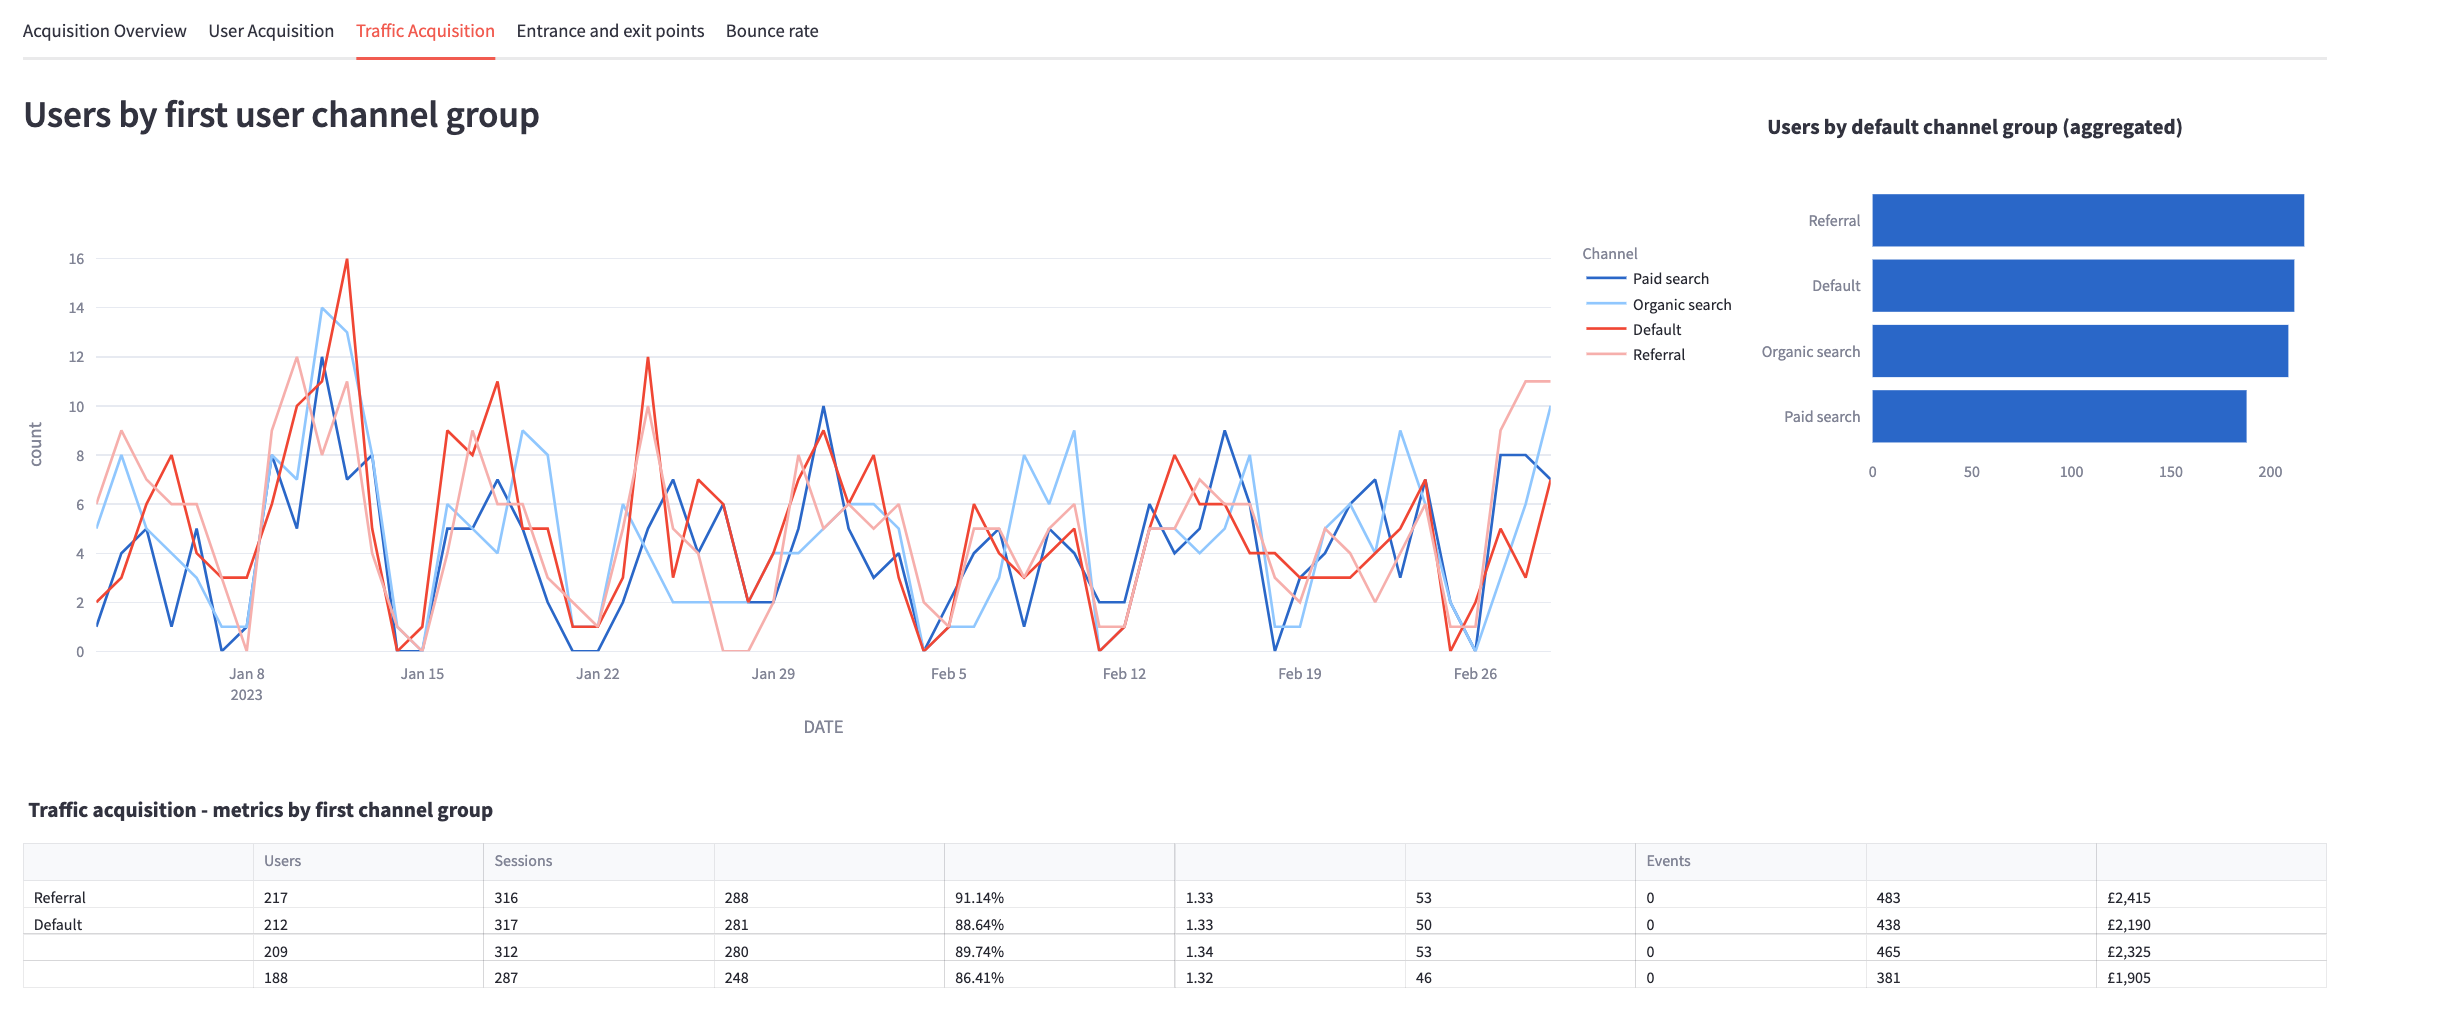
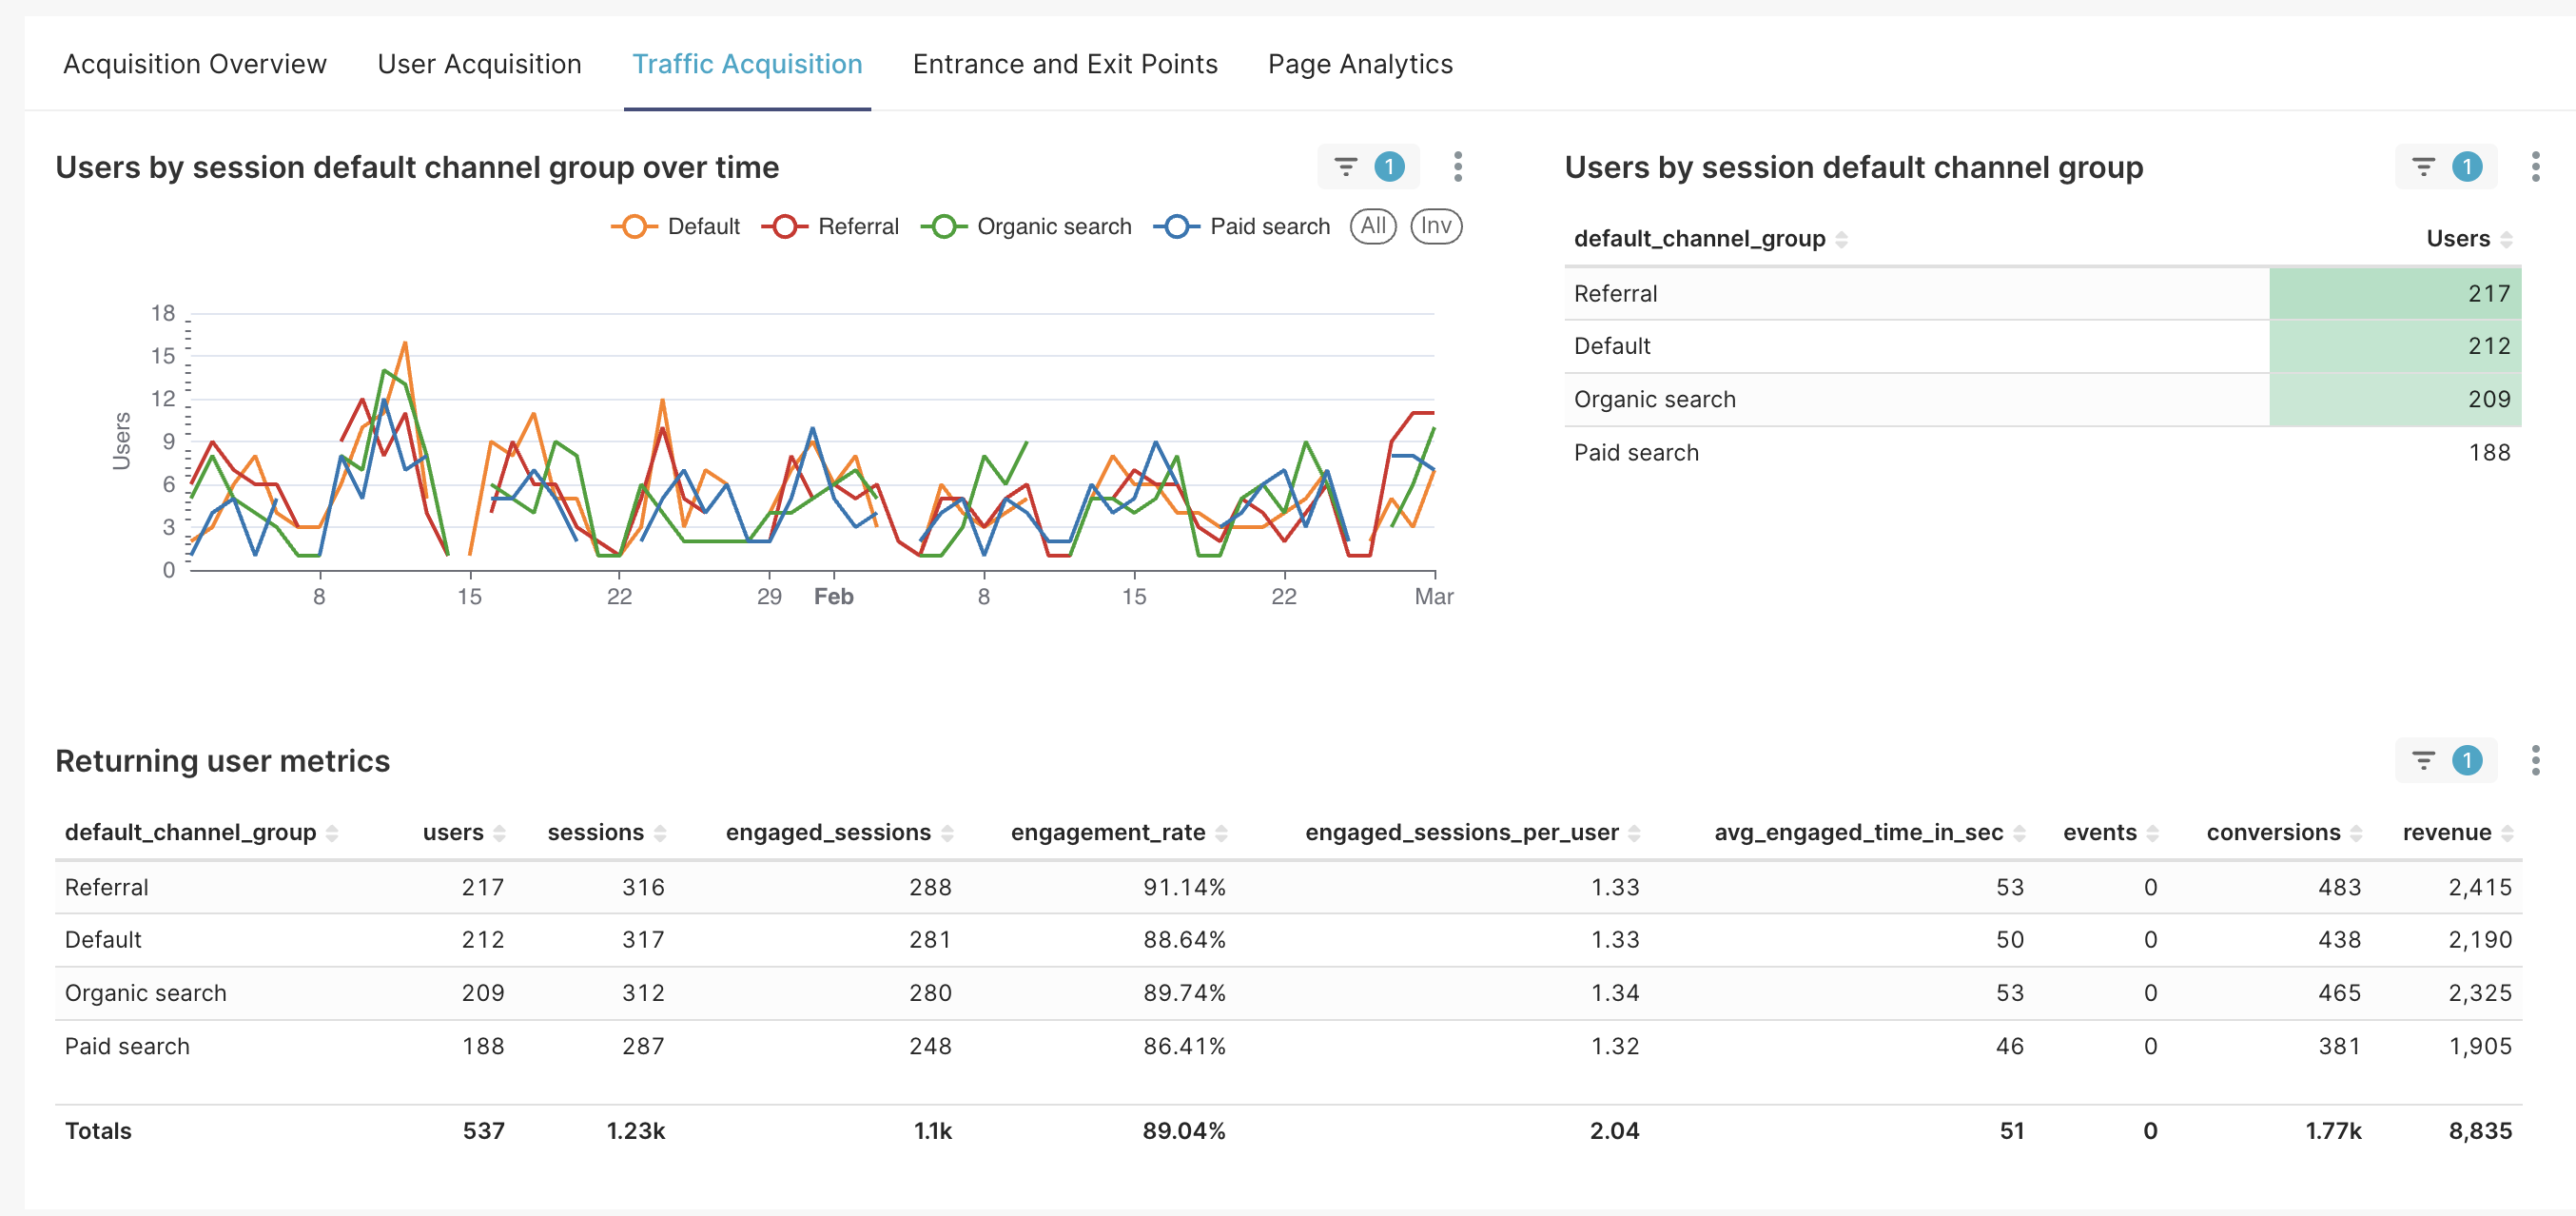
Traffic Acquisition
This page is about Traffic Acquisition which highlights which channels are used to re-engage existing (returning) users.
Every visual is already filtered on returning users only (domain_sessionidx =>1).
The metric are defined as:
- engaged_sessions =
count(case when engaged=True end) - engagement_rate =
engaged_sessions / count(distinct domain_sessionid) - conversion_count =
sum(cv__all_volume) - conversion_revenue =
sum(cv__all_total)
- PowerBI
- Tableau
- Streamlit
- Preset
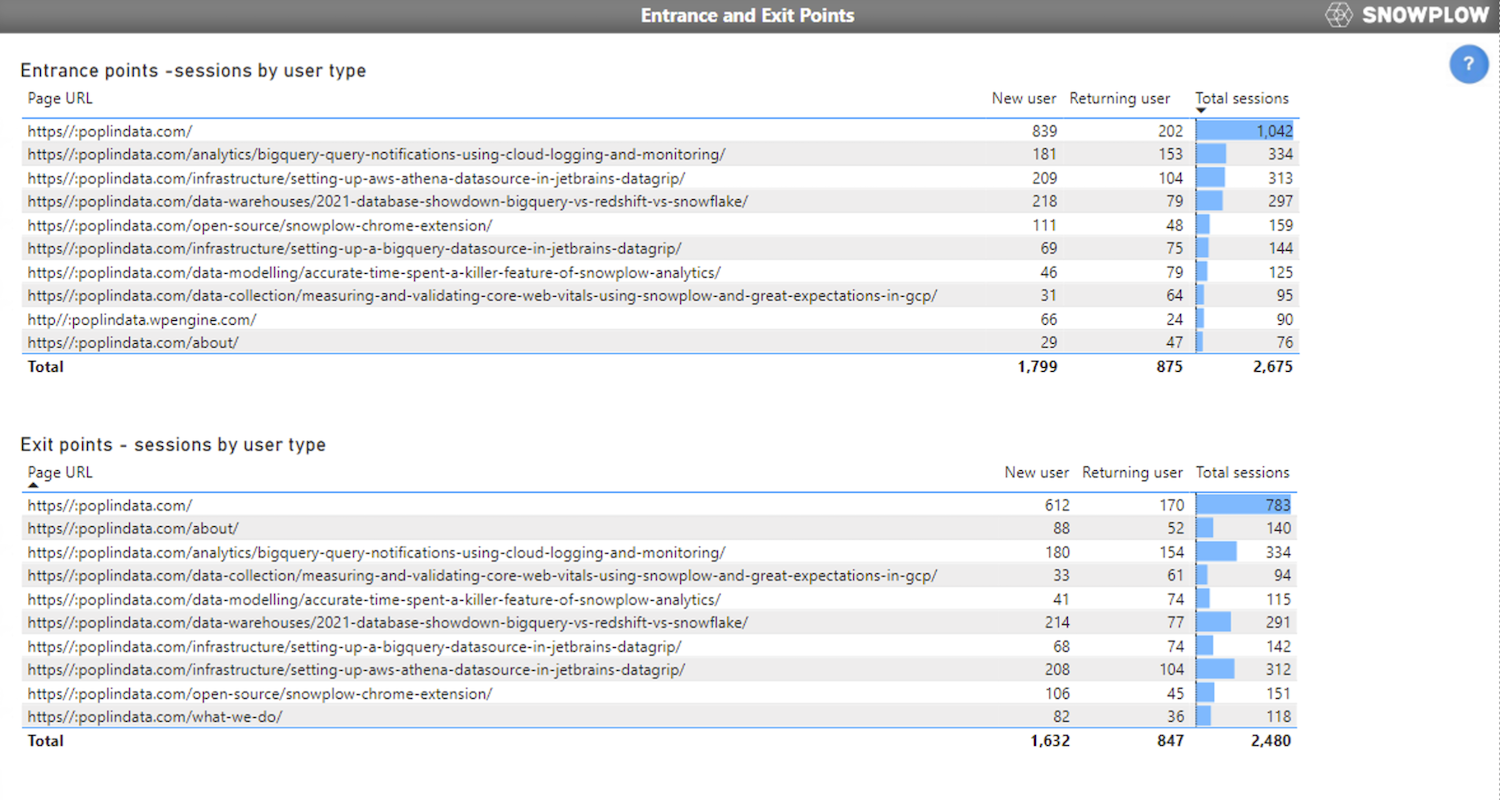
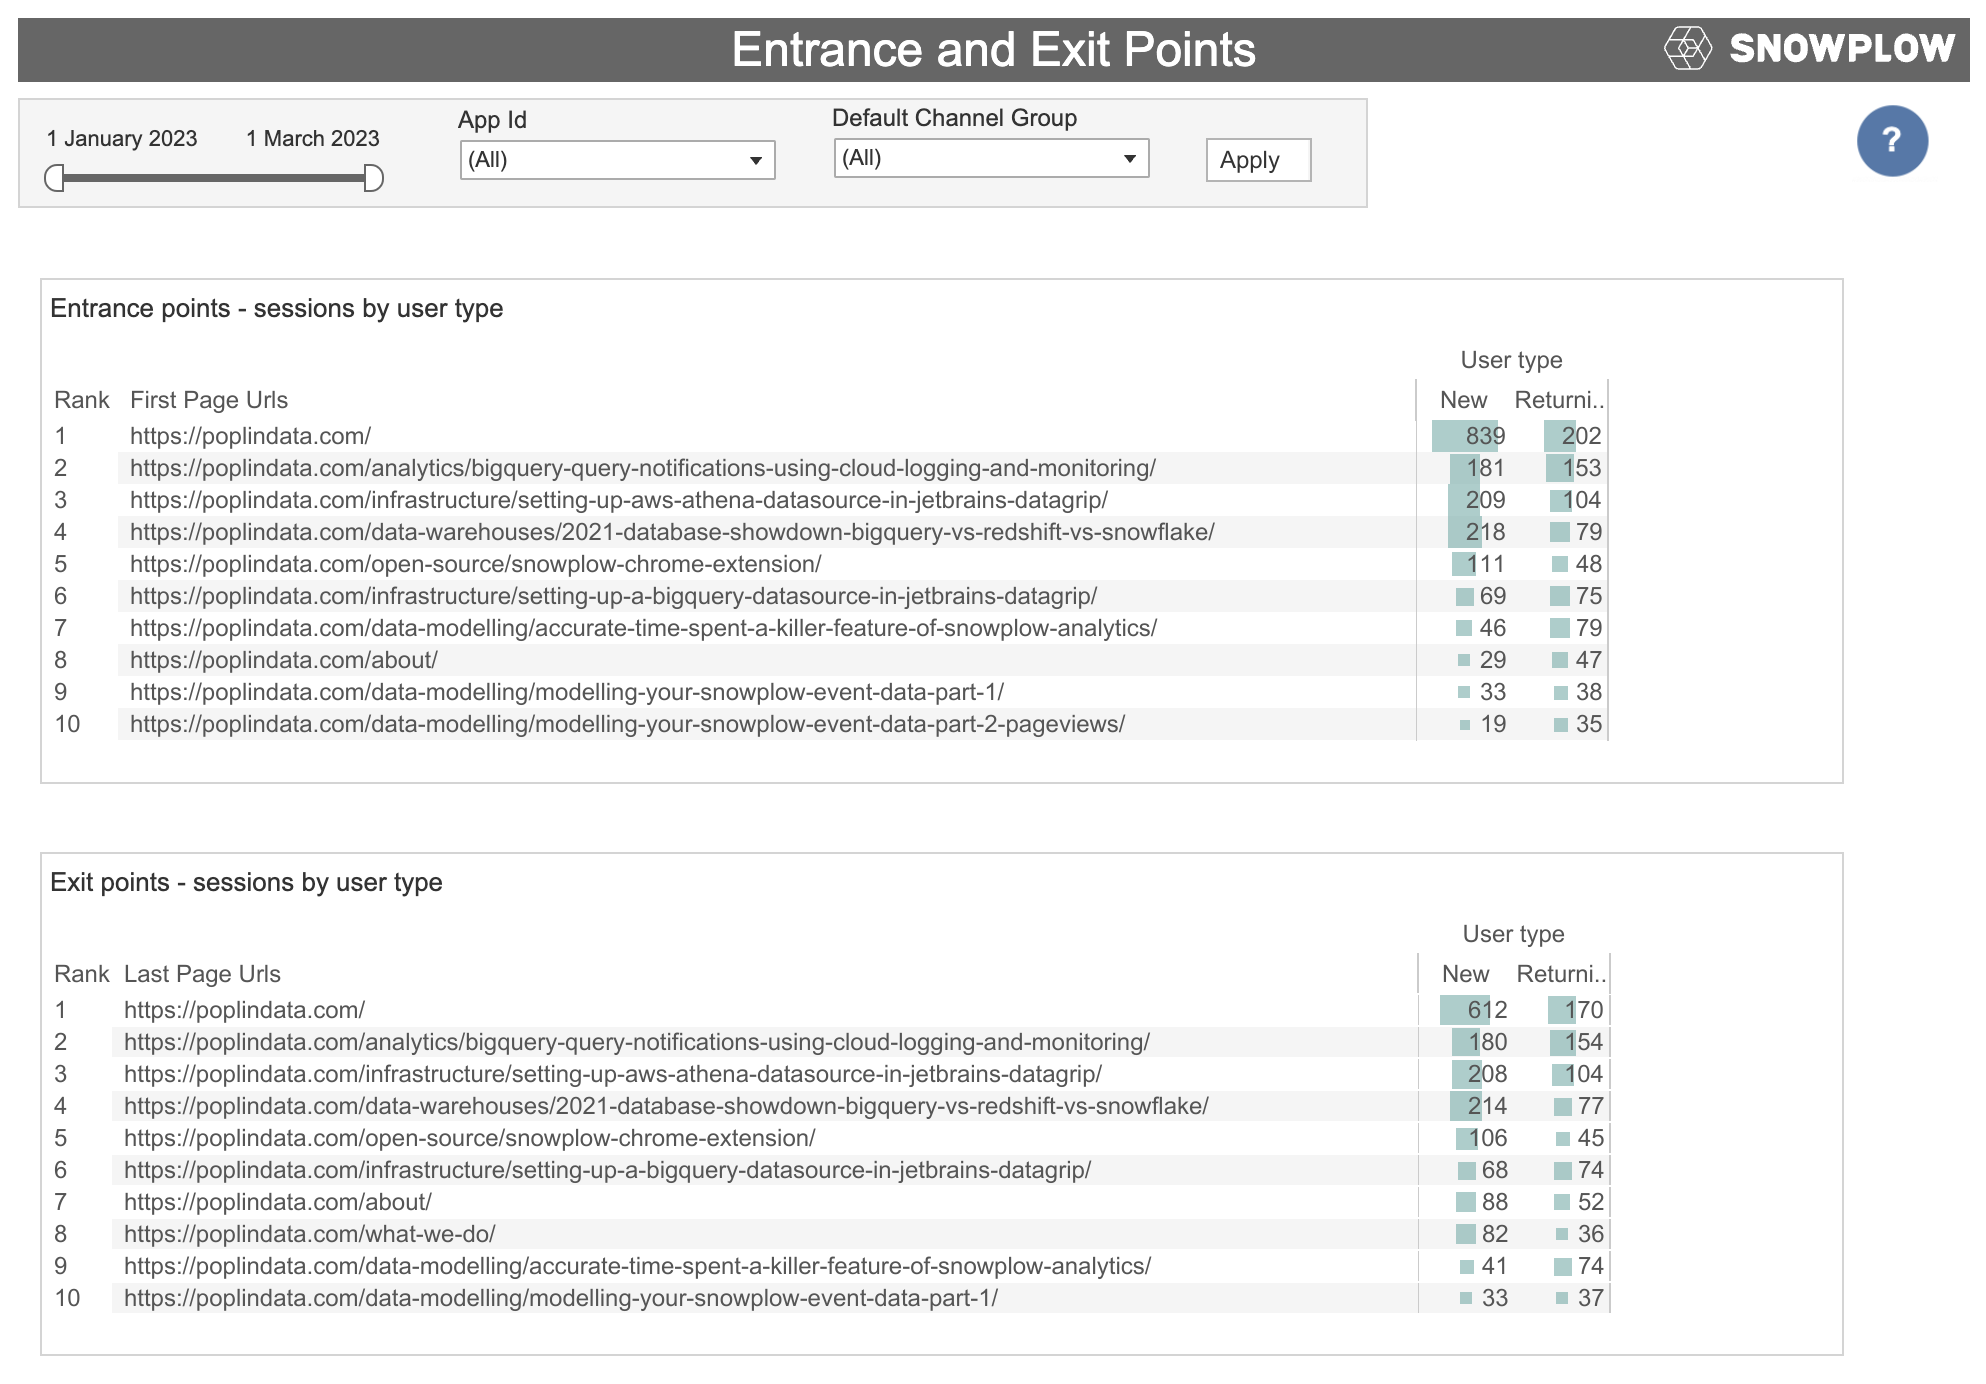
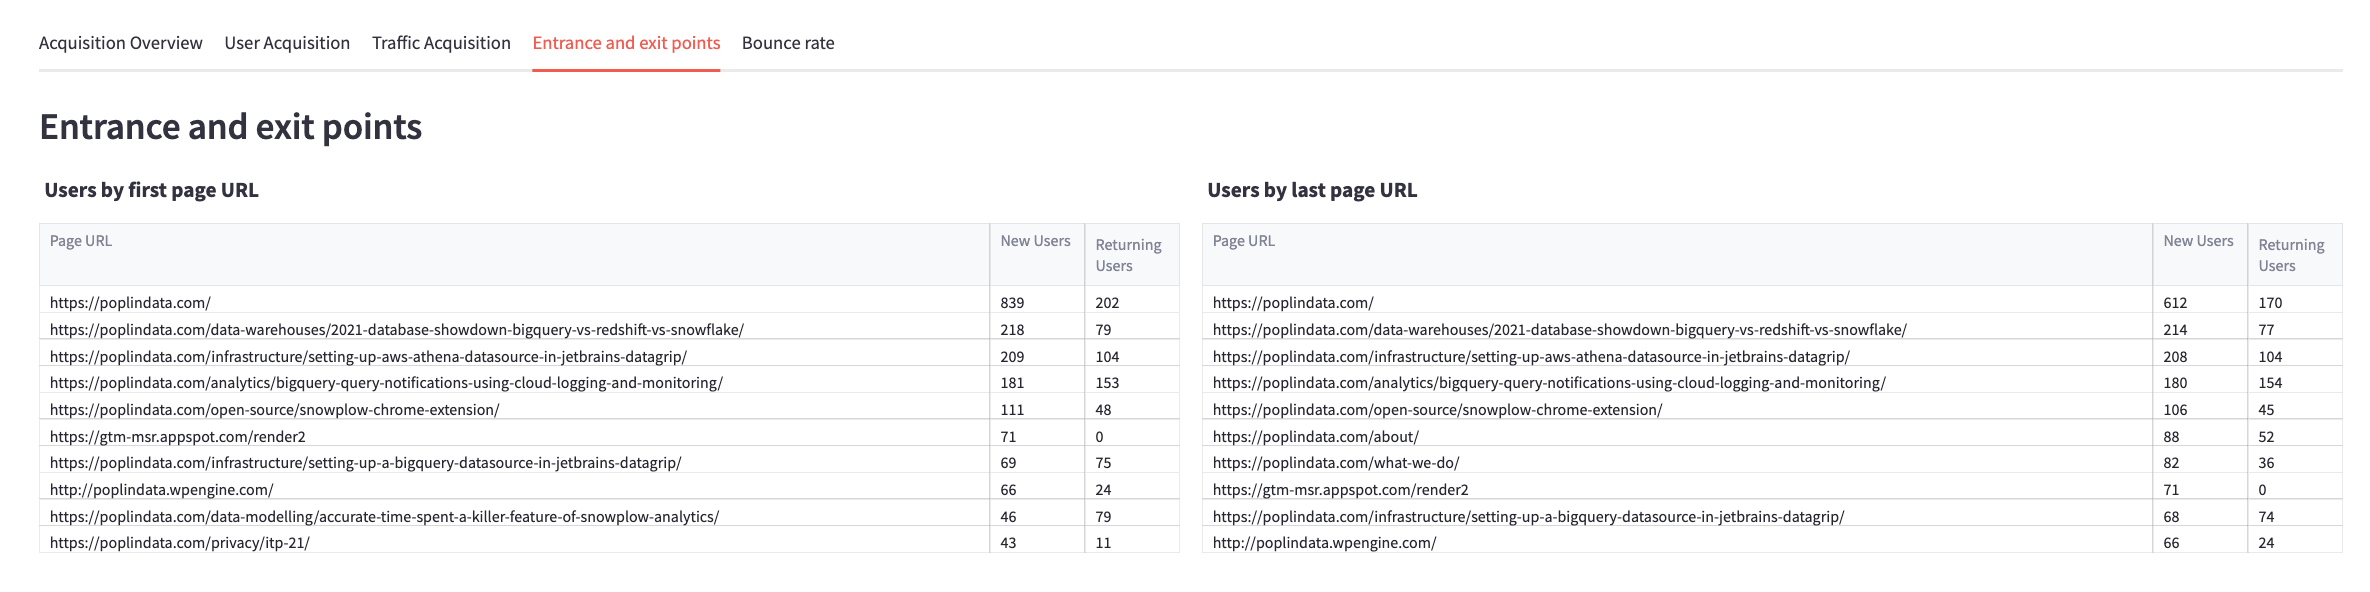
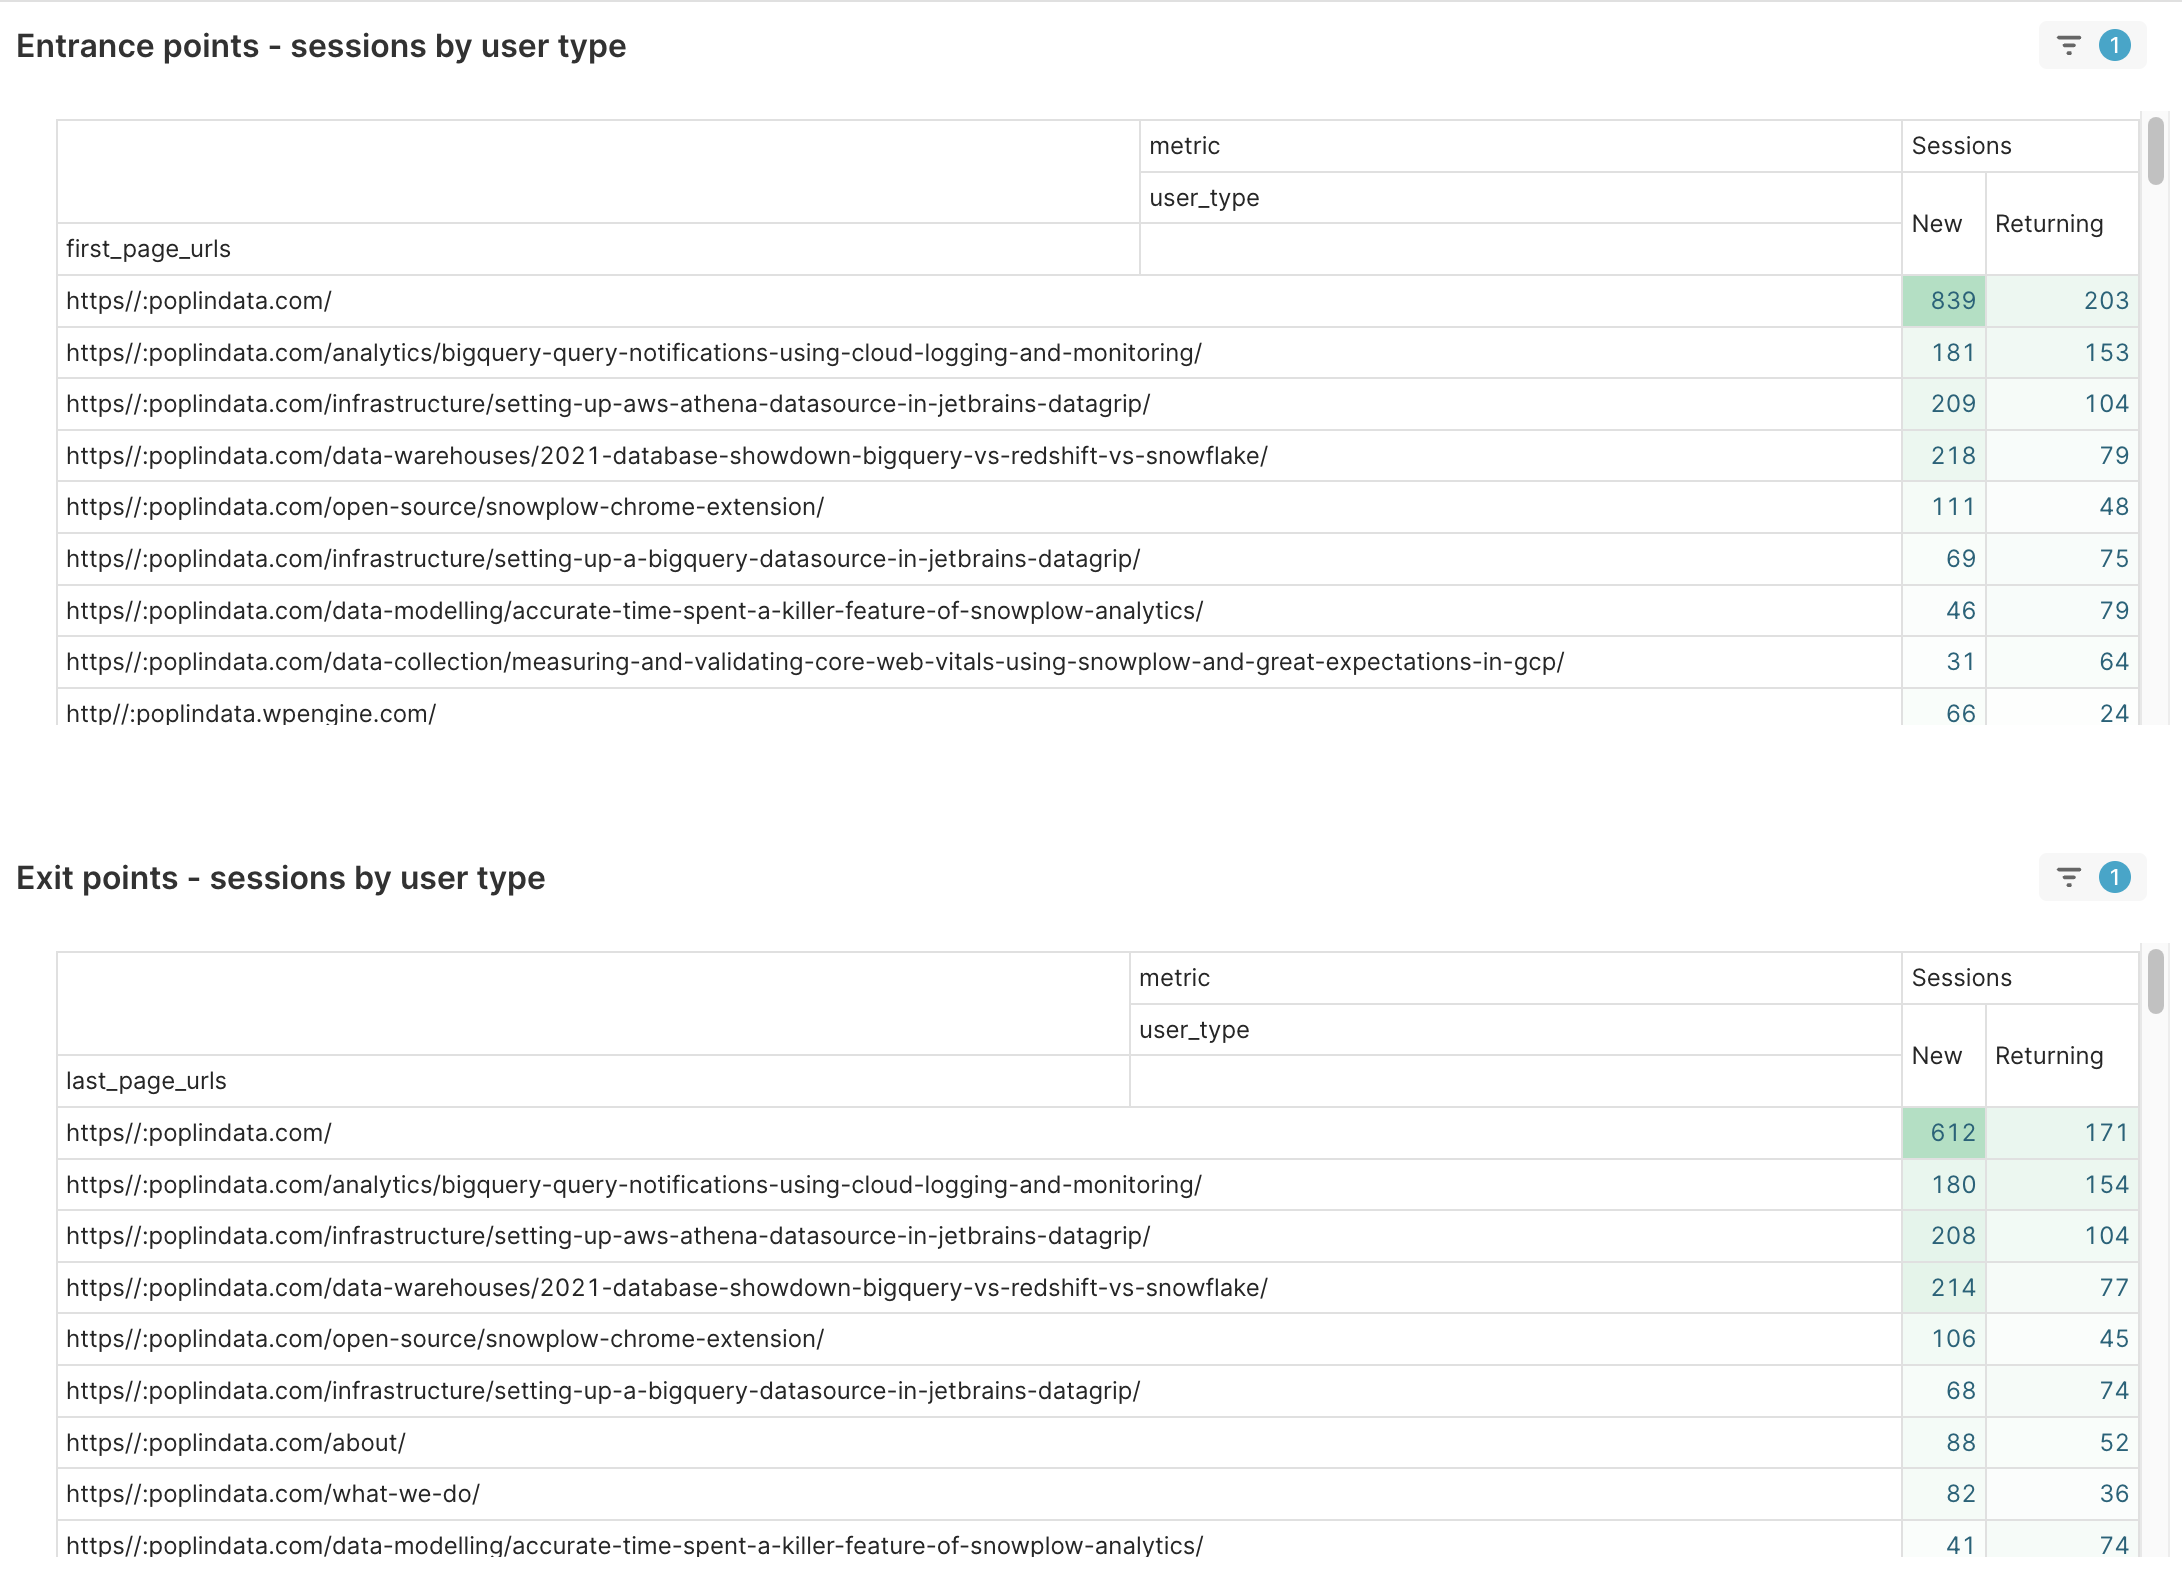
Entrance and Exit Points
A separate overview is dedicated for the top 10 Entrance and Exit points with a breakdown on new and returning users.
An entrance point is the first page URL within a session. Although the sessions table produces a field called first_page_url, for BI purposes we exclude queries or fragments.
Similarly an exit point is the last page URL within a session.
- PowerBI
- Tableau
- Streamlit
- Preset
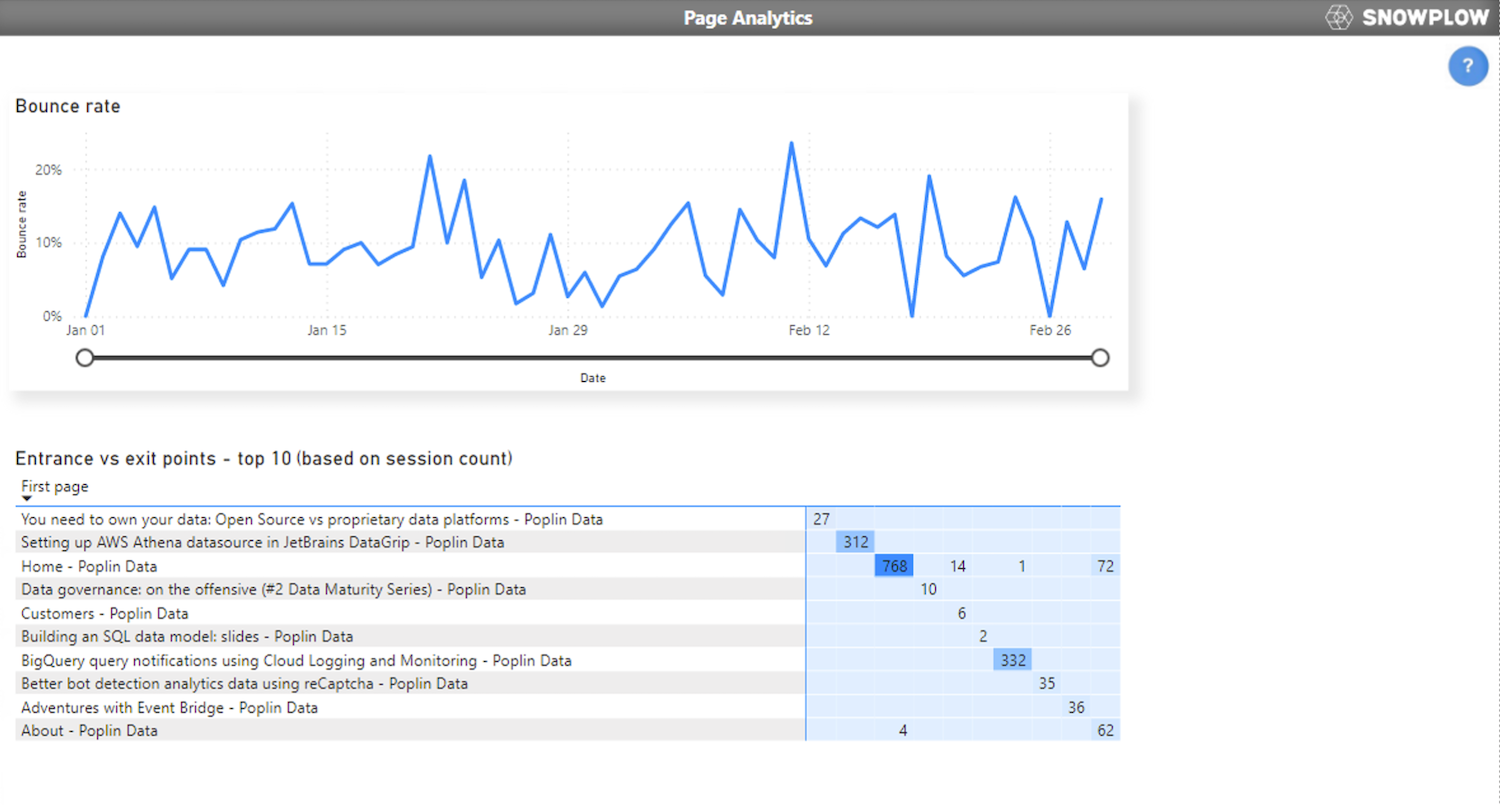
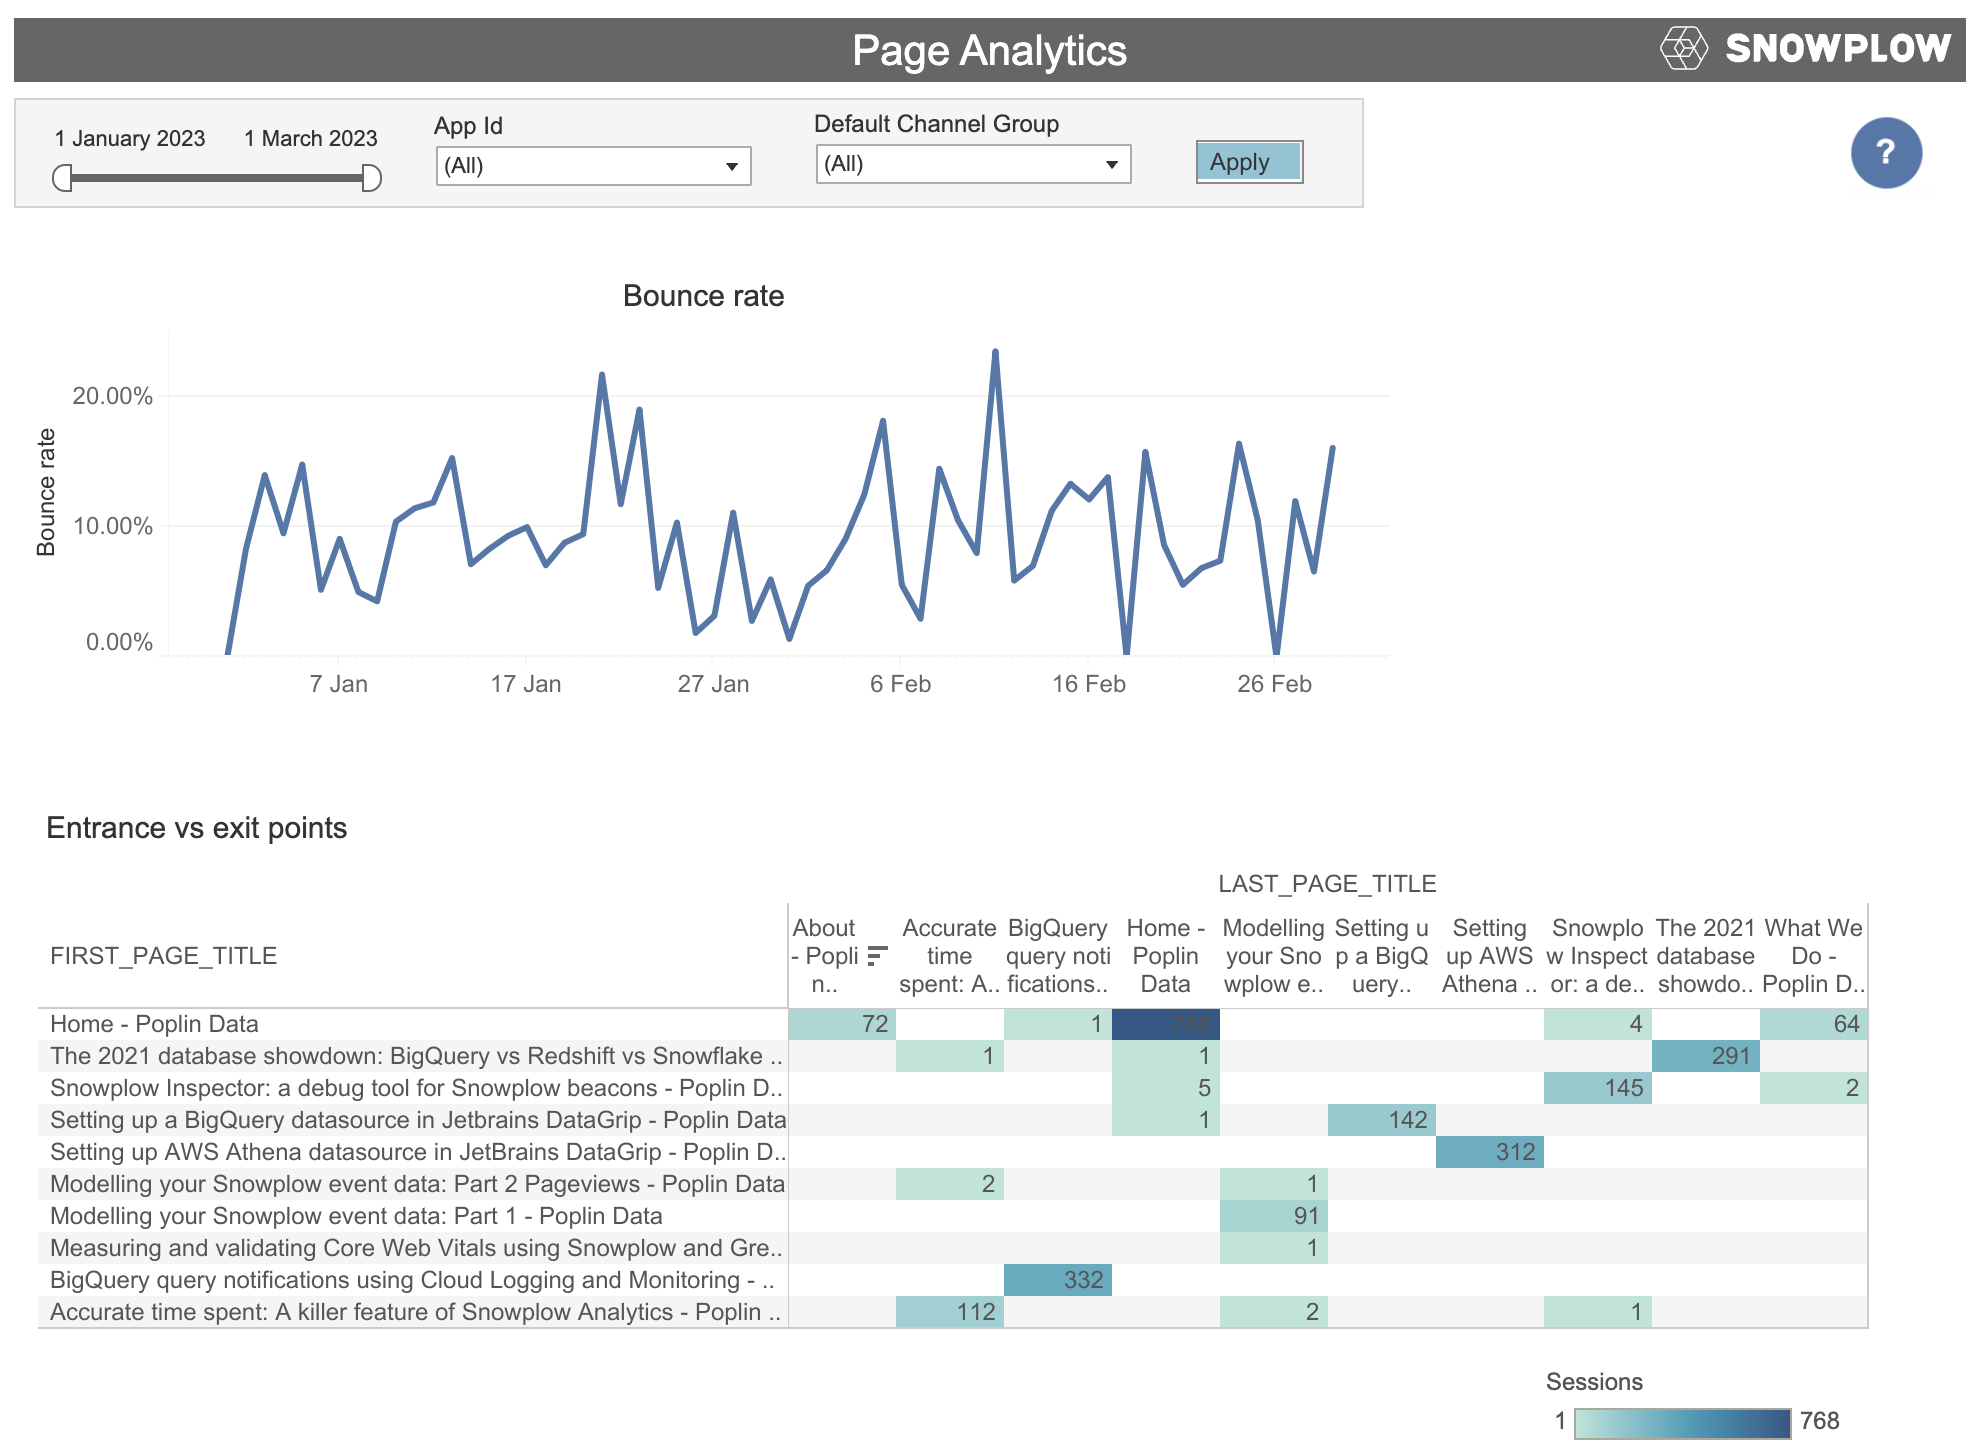
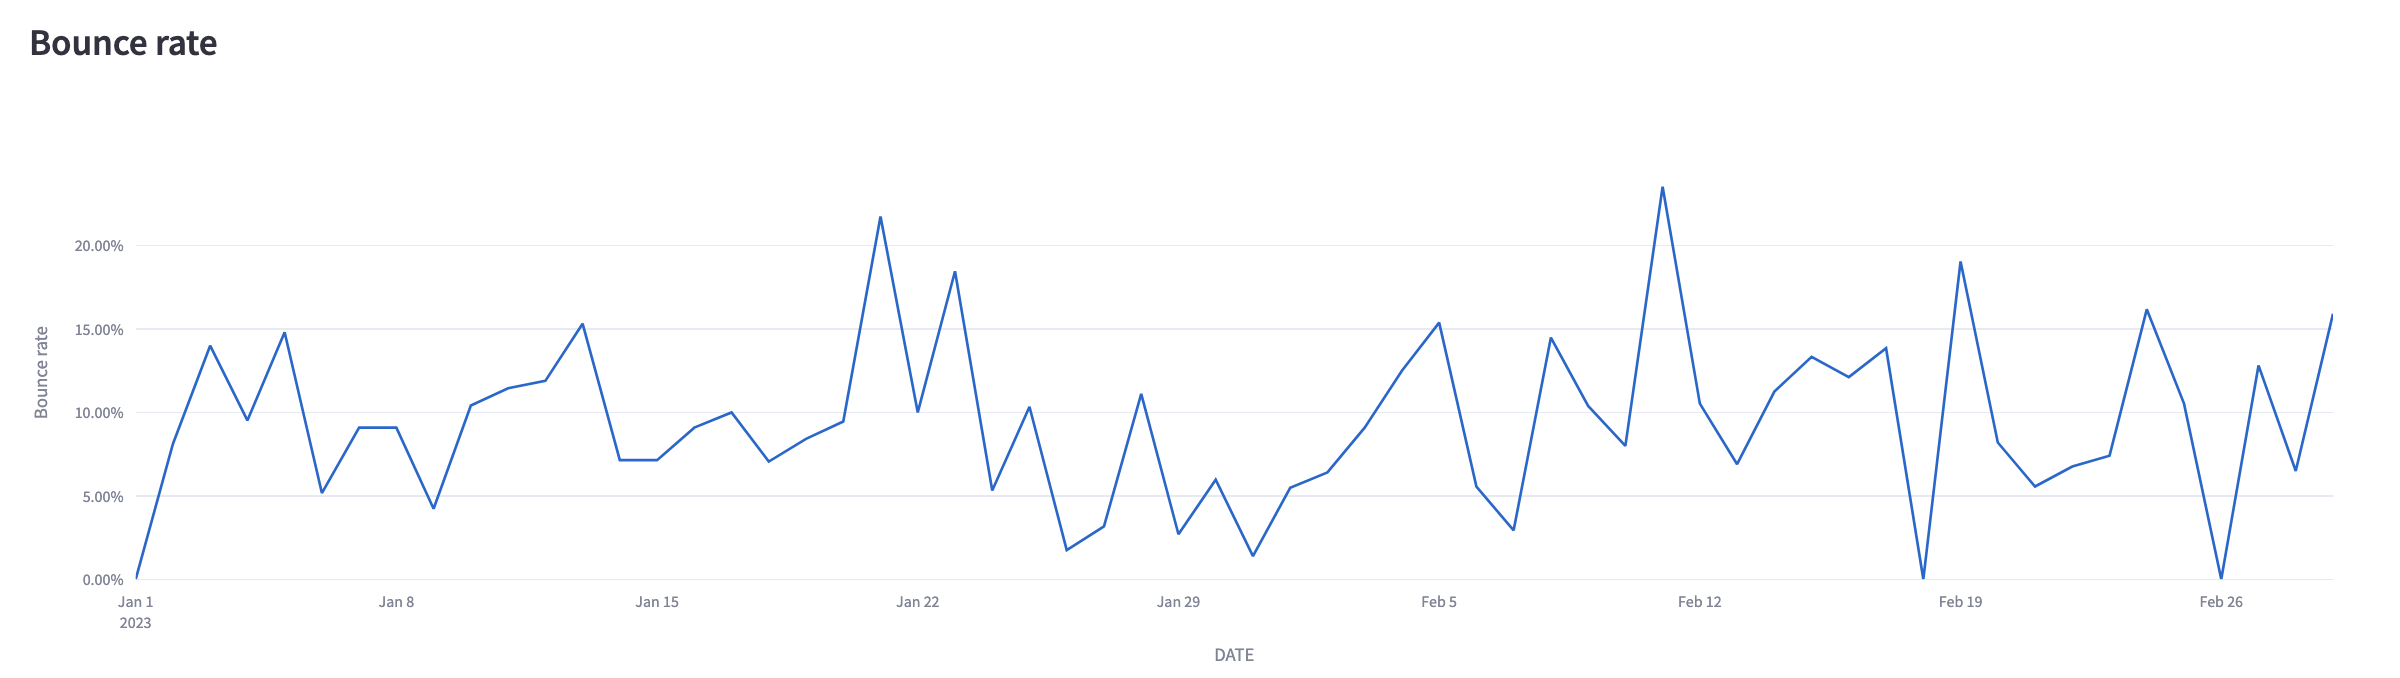
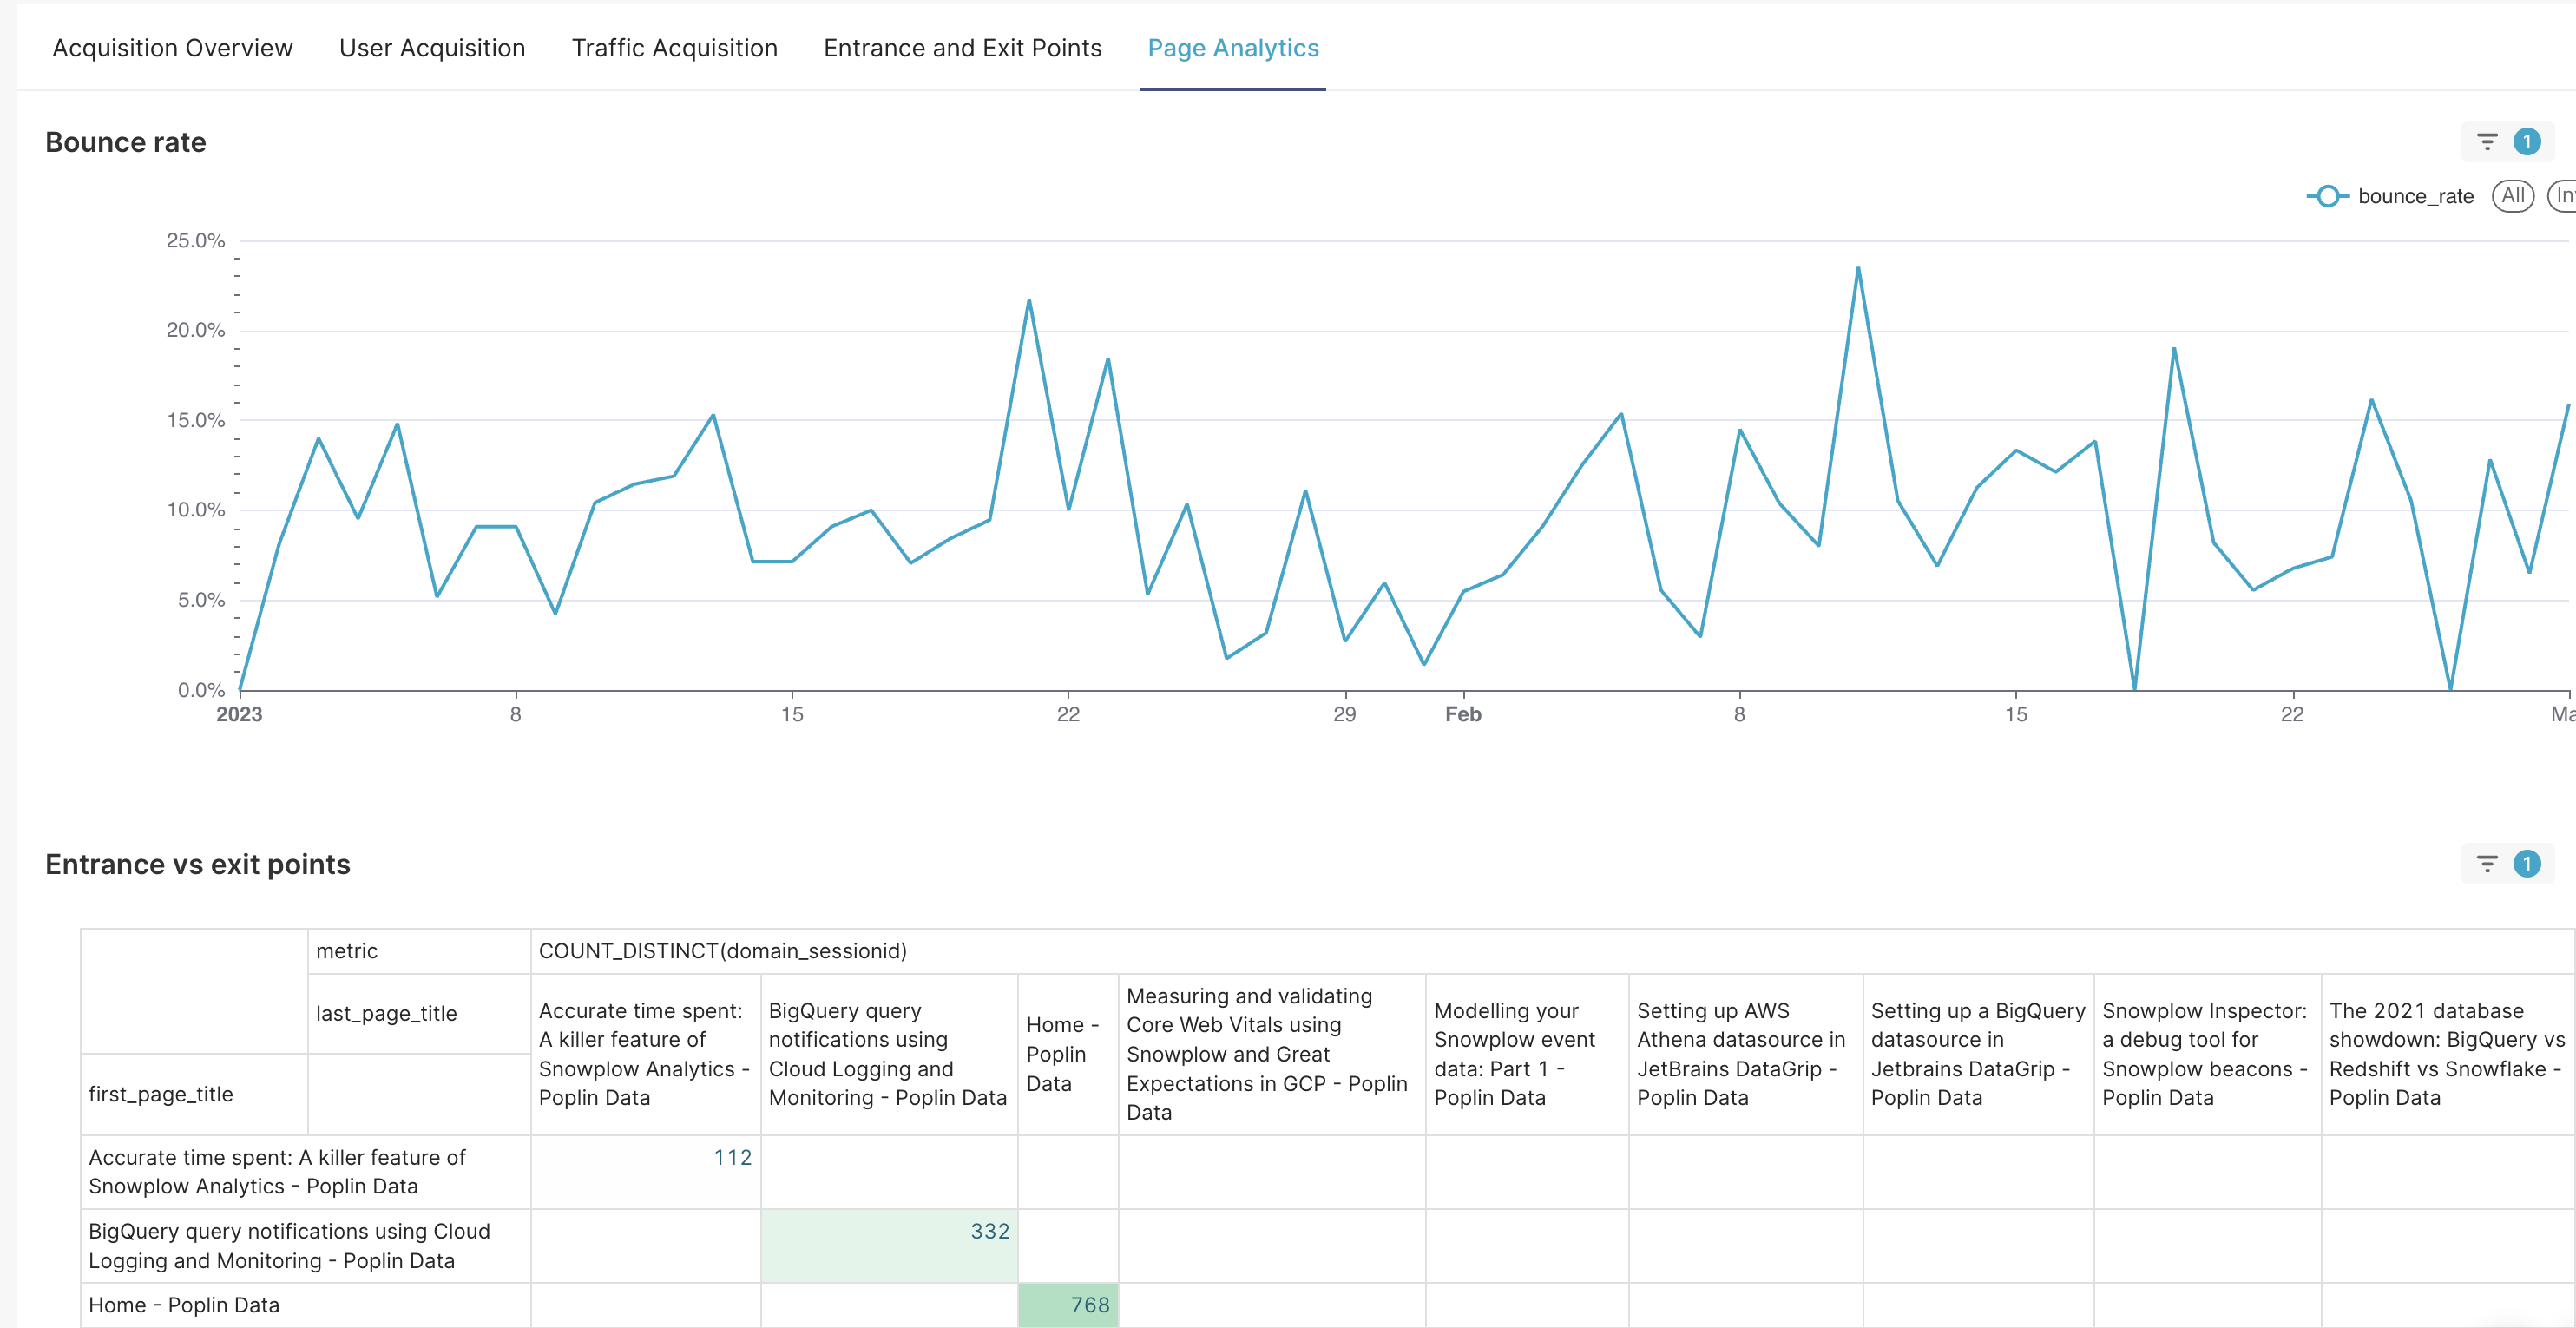
Page Analytics
The Page Analytics view is aimed at giving insight into how the visitors interact with your web page.
The bounce rate visualization is essentially about the inverse of engagement rate, it shows the ratio of non-engaged sessions over the total sessions.
There is also a pivot heat map called the Entrance vs exit points which show the top 10 most visited first pages based on total session_id count and displays the total sessions where the session ended (from the same top 10 pages only).
- PowerBI
- Tableau
- Streamlit
- Preset
Customization
The templates are designed with the intention that they can be used out of the box, therefore we refrained from adding too much styling that might not fit a wide audience's taste. There are many other additional changes you could make to fine-tune the interactivity, enhance the performance or develop it further depending on the tool to make it your own. Please refer to the official documentation of your chosen BI tool for further information on this.